Structure-based analysis of transcriptional regulation
Bruno Contreras Moreira
Fundación ARAID & Estación Experimental de Aula Dei-CSIC, Zaragoza, España http://www.eead.csic.es/compbio | chercheur invité AMU, Marseille, France20/10/2015
- Protein-DNA recognition
- Dissecting a protein-DNA interface
- Atomic interactions between protein and DNA residues
- Direct readout: hydrogen bonds
- Direct readout: Van der Waals interactions
- Indirect/shape readout
- Protein-DNA interface graphs
- Comparison of DNA-binding proteins
- Analysis of protein-DNA interfaces in transcription factors families
- A tour of footprintDB
- Exercise 1: analyzing interfaces and inferring DNA motifs using only sequence data
- Exercise 2: comparing binding interfaces using atomic coordinates
- Mining sequence motifs from the structure of protein-DNA complexes
Protein-DNA recognition
DNA-binding proteins contain DNA-binding domains and have a specific or general affinity for either single or double stranded DNA. Here we will concentrate mostly on transcription factors, which generally recognize cis-regulatory elements in double-stranded DNA molecules.
Dissecting a protein-DNA interface
Transcription factors recognize target DNA sequences through a binding interface, composed of protein residues and DNA stretches in intimate contact. The best descriptions of protein-DNA interfaces are provided by structural biology, usually by X-ray or NMR experiments.

Details of the interface of Lac repressor and its operator site ( Lewis et al. (1996))

Details of the interface of Lac repressor and its operator site ( Lewis et al. (1996))

Cartoon dissection of the interface of a NarL dimer (PDB entry 1JE8)
Atomic interactions between protein and DNA residues
The process of recognition of DNA sequences by proteins involves readout mechanisms, and also accessory stabilizing atomic interaction that do not confer specificty.
Direct readout
- Hydrogen bonds: direct + water-mediated
- Hydrophobic interactions
Indirect readout
- Sequence-specific deformation of DNA base steps
Stabilizing interactions
- Not sequence-specific, involving DNA backbone
Direct readout: hydrogen bonds

Donor and acceptor hydrogen bond atoms in nitrogen bases, from Luscombe, Laskowski, and Thornton (2001)
Direct readout: Van der Waals interactions

DNA bases display VdW interactions involving mainly C atoms, from Luscombe, Laskowski, and Thornton (2001)

Sequence-specific VdW interactions involve fundamentally thymine-C5M group, adapted from Luscombe, Laskowski, and Thornton (2001)
Indirect/shape readout
Besides atomic interactions between protein and DNA, sequence-dependent deformability of duplexes, deduced from crystal complexes, implies that sequence recognition also involves DNA shape.

DNA step geometry descriptors, from X. J. Lu and Olson (2008)
DNA deformation is described by the increase in energy brought about by instantaneous fluctuations of the step parameters from their equilibrium values:
\(deformation = \displaystyle\sum_{i=0}^6 \displaystyle\sum_{j=0}^6 spring_{ij} \Delta\theta_{i,st} \Delta\theta_{j,st}\) (Olson et al. (1998))

Roll and twist of DNA steps are different for purine and pyrimidine steps, from Olson et al. (1998)
The accumulation of experimental and molecular dynamics data of DNA molecules currently supports predictive algorithms, such as DNAshape, which predict the geometry of DNA sequences:

Geometry descriptors of a DNA duplex by sliding a sequence window, from Zhou et al. (2013). MGW=Major Groove Width.
Protein-DNA interface graphs
Interfaces can be explored as generic bipartite graphs (Sathyapriya, Vijayabaskar, and Vishveshwara (2008)) or with sub-graphs that focus only on specific sequence recognition:

Interface graph of NarL, where solid bases indicate indirect readout and arrows direct readout interactions. Adapted from 3d-footprint (Contreras-Moreira (2010))
Comparison of DNA-binding proteins
A great variety of DNA-binding proteins has been observed in nature, which can be analyzed and compared in terms of the features introduced above, such as readout, or instead with an evolutionary or topological perspective.

Example HTH transcription factors from the work of Luscombe et al. (2000)
The Structural Classification of Proteins (SCOP) systematically groups protein folds in superfamilies, of which some are the most common DNA-binding proteins. The next table shows superfamilies with more than 20 non-redundant complexes in the Protein Data Bank as of October, 2015, as annotated in the database 3d-footprint:
| SCOP superfamily | Number of complexes |
|---|---|
| Winged helix (WH) | 77 |
| Homeodomain-like (H) | 63 |
| Glucocorticoid-receptor-like (GR) | 33 |
| Restriction endonuclease-like (RE) | 24 |
| Homing endonuclease (HE) | 23 |
| p53-like (P53) | 21 |
| Lambda-repressor-like (LR) | 21 |

Number of hydrogen bonds and VdW interactions across some SCOP superfamilies of DNA-binding proteins (right) and total atomic contacts per monomer (left). ZF=C2H2 Zinc Finger, RHH=Ribbon-helix-helix, from Contreras-Moreira, Sancho, and Angarica (2010)

Frequency of distorted DNA steps (indirect readout) of target DNA sites of some SCOP superfamilies of DNA-binding proteins, from Contreras-Moreira, Sancho, and Angarica (2010)
Analysis of protein-DNA interfaces in transcription factors families
The available experimental structures of protein-DNA complexes in the PDB support the annotation of interface residues, those involved directly in sequence recognition, within protein families.

Annotation of interface residues by transference from PDB complexes in the footprintDB database
Several examples in the literature have demonstrated the correlation between interface patterns and the bound DNA motifs within large transcription factor families, such as the work of Noyes et al. (2008):

Relation between (annotated) interface residues and cognate DNA motifs or homeobox transcription factors, from Noyes et al. (2008).
Structural data are key for the study of interfaces, as well as the structural superposition of DNA-binding domains:

Alignment and superposition of 35 C2H2/C2HC zinc finger domains. (A) Structure-based multiple sequence alignment with summary of interface residues at the bottom. (B) Backbone cartoon of the corresponding structural superposition. (C) Summary of four side chain rotamer clusters found for interface residues aligned in column 20 of the multiple alignment, from Contreras-Moreira, Sancho, and Angarica (2010).
The study of interfaces must be done in the appropriate biological context, for instance considering the oligomerization state of TFs in vivo, as each family of transcription factors has singularities, such as these (compiled by Álvaro Sebastián):
| Family | Motifs | Multimeric | Multidomain |
|---|---|---|---|
| Homeodomain | TAATkr,TGAyA | Sometimes | Unusual |
| Basic helix-loop-helix (bHLH) | CACGTG,CAsshG | Always (homodimers, heterodimers) | Never |
| Basic leucine zipper (bZIP) | CACGTG,-ACGT-,TGAGTC | Always (homodimers, heterodimers) | Never |
| MYB | GkTwGkTr | Common (multimers) | Common |
| High mobility group (HMG) | mTT(T)GwT,TTATC,ATTCA | Sometimes | Unusual |
| GAGA | GAGA | Never | Never |
| Fork head | TrTTTr | Unusual | Never |
| Fungal Zn(2)-Cys(6) binuclear cluster | CGG | Common (homodimers) | Never |
| Ets | GGAw | Common (homodimers, heterodimers, multimers) | Never |
| Rel homology domain (RHD) | GGnnwTyCC | Always (homodimers, heterodimers) | Never |
| Interferon regulatory factor | AAnnGAAA | Always (homodimers, heterodimers, multimers) | Never |
A tour of footprintDB
FootprintDB is a meta-database that integrates the most comprehensive freely available libraries of curated cis elements and systematically annotates the binding interfaces of the corresponding TFs.

Most populated species (A) and SCOP superfamilies of TFs (B) in footprintDB database, from Sebastian and Contreras Moreira (2014)

Largest repositories included in footprintDB (top) and comparison of the contents of footprintDB, JASPAR and commercial database TRANSFAC v2012.1 (bottom) (Sebastian and Contreras Moreira (2014))
FootprintDB takes two types of queries: 1. Transcription factors which bind a specific DNA site or motif. 2. DNA motifs likely to be recognized by a specific DNA-binding protein.

Query types supported by footprintDB
Exercise 1: analyzing interfaces and inferring DNA motifs using only sequence data
In summary, interfaces seem to be relevant for proteins that bind to DNA in a sequence-specific manner. How can we define the interface of a protein sequence of interest? If the protein structure has been experimentally analyzed docked to a DNA ligand, then this is the best option. Several resources can help us in this task, such as NPIDB or 3D-footprint. Others such as BIPA, PDIdb as also very useful, but are less frequently updated.
However, for most protein sequences structural data is simply not available. In these cases interface residues can only be predicted based on the structures of homologous DNA-binding proteins, and that’s precisely what footprintDB does. In addition to interface annotation, footprintDB annotates a wide selection of high quality DNA motifs, extracted from a series of public databases. We will demonstrate its use now with human hox-b1:
>Homeobox protein hox-b1 (part of P40424|PBX1_HUMAN)
MEPNTPTART FDWMKVKRNP PKTAKVSEPG LGSPSGLRTN FTTRQLTELE
KEFHFNKYLS RARRVEIAAT LELNETQVKI WFQNRRMKQK KREREGGIf you paste the protein sequence of hox-b1 in the sequence search form of footprintDB you’ll get a list of similar proteins, with annotated interfaces in most cases, together with their experimentally derived DNA motifs.
Can you check the interfaces of the matched transcription factors (TF) and tell whether they are conserved? NOTE: You can check the alignments clicking in the BLAST e-value or interface similarity links.
Compare the cognate DNA motifs of TFs with different annotated interfaces.
If you have admin rights on a Linux/OS-X machine please install Perl module SOAP::Lite with an appropriate command such as
sudo cpan -i SOAP::Liteand then save the next script and run it on you terminal withperl script.pl:
#!/usr/bin/perl -w
use strict;
use SOAP::Lite;
my $footprintDBusername = ''; # your username if registered
my ($result,$sequence,$sequence_name) = ('','','');
my $server = SOAP::Lite
-> uri('footprintdb')
-> proxy('http://floresta.eead.csic.es/footprintdb/ws.cgi');
$sequence_name = 'hox-b1';
$sequence = 'MEPNTPTART FDWMKVKRNP PKTAKVSEPG LGSPSGLRTN FTTRQLTELE KEFHFNKYLS RARRVEIAAT LELNETQVKI WFQNRRMKQK KREREGG';
$result = $server->protein_query($sequence_name,$sequence,$footprintDBusername);
unless($result->fault()){ print $result->result(); }
else{ print 'error: ' . join(', ',$result->faultcode(),$result->faultstring()); }- In order to just predict interfaces of your sequences you can use the next script:
#!/usr/bin/perl -w
use strict;
use SOAP::Lite;
my $URI = 'http://floresta.eead.csic.es/footprint';
my $WSURL = 'http://floresta.eead.csic.es/3dpwm/scripts/server/ws.cgi';
my $soap = SOAP::Lite
-> uri($URI)
-> proxy($WSURL);
my $result = $soap->protein_query('MEPNTPTART FDWMKVKRNP PKTAKVSEPG LGSPSGLRTN FTTRQLTELE KEFHFNKYLS RARRVEIAAT LELNETQVKI WFQNRRMKQK KREREGG');
unless($result->fault){ print $result->result(); }
else{ print 'error: ' . join(', ',$result->faultcode,$result->faultstring); }

First rows of footprintDB results for query hox-b1.
Exercise 2: comparing binding interfaces using atomic coordinates
Here we will test a structural alignment approach for the comparison of DNA-binding proteins and their interfaces, as discussed in the literature (Siggers, Silkov, and Honig (2005), Sebastian and Contreras-Moreira (2013)). In this context superpositions are a tool to guide the correct alignment of cis elements bound by homologous proteins, as illustrated in the figure.

Sequence and structue alignment of cis-elements bound by two homologous PDB complexes: 3A01_A1 and 1FJL_B1. Note that this optimal sequence alignment does not match equivalent interface positions, adapted from Sebastian and Contreras-Moreira (2013).
This kind of analysis can be done with publicly available software, such as locally installed Protein-DNA_Interface_Alignment, or the web server TFcompare, which we will test in this session:
Visit the Protein Data Bank and check entries 3A01 and 1FJL: what are these proteins?
Type both PDB codes in the search form of http://floresta.eead.csic.es/tfcompare and wait for your results.
How many domains are annotated in each protein, of which Pfam families?
Spot the pairs of domains with lowest protein and DNA root-mean square deviations (RMSD) and check their 3D alignments to visually check their fit. Is there an obvious structure-based cis element alignment? NOTE: you might need to add floresta.eead.csic.es as an exception in your Java config to display Jmol.
Mining sequence motifs from the structure of protein-DNA complexes
Here we will see two complementary ways to infer sequence motifs recognized by transcriptions factors for which a protein-DNA complex structure has been solved.
Total contacts model: Morozov algorithm

After counting all heavy-atom contacts per base pair, the algorithm is as follows (Morozov and Siggia (2007)):
- \(C_{n} = contacts(n) / 20\) , (\(4.5A\) heavy atoms)
- Each value in the resulting frequency DNA motif is: \(W_{n,b}(contacts) = \begin{cases}1 (1 + 3C_{n}) & (b = consensus),\\1 (1-C_{n}) & (b \neq consensus)\end{cases}\)
Readout model: DNAPROT algorithm

The DNA algorithm explicitly estimates direct + indirect readout and really is an in silico mutagenesis experiment of native DNA with the following steps involved:
Perform \(4N\) mutations in template DNA:

Score mutations with statistical potentials and calculate each value in the resulting weight matrix with this expression, where D is the relative weight of indirect readout: \(W_{n,b} = e^{(-((1-D)*direct(n,b) + D * indirect(n,b)))}\)
Compared to the approach of Morozov and Siggia (2007), this protocol is computationally more expensive and it is, in our experience, more dependent on the quality of the underlying structural data.
Further details of this algorithm are available in Espinosa Angarica et al. (2008), and binaries (and source code) of DNAPROT, which implements both strategies, is available at http://eead.csic.es/compbio/soft/dnaprot.php. The atomic pair potentials of interaction are updated weekly and are available at http://floresta.eead.csic.es/3dfootprint/download.html.
Specificity-based classification of DNA-binding proteins
DNA motifs resulting from combinations of both previously described strategies are routinely calculated for PDB complexes annotated in 3D-footprint, and ultimately included in footprintDB.
These structure-based DNA motifs, analyzed in terms of their information content, are also used to feed a plot of the specificity of SCOP superfamilies, updated weekly at http://floresta.eead.csic.es/3dfootprint/stats/superfam_specificity.png:
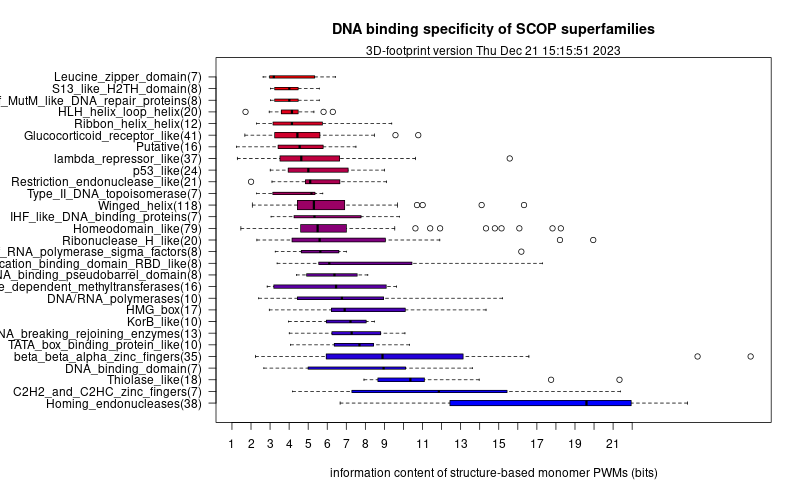

Information content of structure-derived DNA motifs of proteins belonging to several SCOP superfamilies as of October, 2015, after Contreras-Moreira (2010)
Exercise 3: obtaning and evaluating structure-based motifs
Here we will learn i) how to produce a structure-based motif out of a protein-DNA complex in PDB format and ii) how to evaluate its predictive value. With these goals in mind I suggest we can work with any of the following Escherichia coli TFs originally annotated in RegulonDB:
| protein name | footprintDB entry | matrix-quality report |
|---|---|---|
| Ada | 1zgw_A | Ada_1zgw_A |
| CRP | 1cgp_AB | CRP_1cgp_AB |
| DnaA | 1j1v_A | DnaA_1j1v_A |
| FadR | 1hw2_AB | FadR_1hw2_AB |
| LacI | 1efa_AB | LacI_1efa_AB |
| MarA | 1bl0_A | MarA_1bl0_A |
| NarL | 1je8_AB | NarL_1je8_AB |
| PhoB | 1gxp_AB | PhoB_1gxp_AB |
| PurR | 2pua_A | PurR_2pua_A |
| Rob | 1d5y_AB | Rob_1d5y_AB |
| TrpR | 1rcs_AB | TrpR_1rcs_AB |
- Inspect the footprintDB entry of one or more of these TFs and,
- 1.1 check the primary accession to find the corresponding Protein Data Bank structure.
- 1.2 Check the information content of the structure-based DNA motif
- In the PDB site,
- 2.1 In the “Molecular Description” section, check how many protein and DNA molecules are captured in the structure.
- 2.2 Download the ‘PDB File (Test)’ with the coordinates of the complex to a local file in your computer. If there is more than 1 complex edit the file and leave only one of them. Software such as Rasmol or PyMOL can be useful for this task.
- Visit the 3D-footprint interactive tool, upload your PDB file and submit the job. You might want to try several parameter combinations. By default readout (DNAPROT) and contact (Morozov) matrices are averaged with equal weights.
- 3.1 Revise the “Original Interface contacts” and the interface graph, what kind of interactions where detected?
- 3.2 Compare the “readout” and “contact” sequence logos, are they compatible or perhaps there are some inconsistencies?
- 3.3 Save the structure-based DNA motif produced to a local file.
- Visit RSAT::matrix-quality (Medina-Rivera et al. (2011)) and evaluate the predictive value of the obtained matrix (tab format) by comparing it to the corresponding set of experimentally obtained cis regulatory sites (see Table) by scanning all E.coli K12 upstream regions in this file: Escherichia_coli_K12_allup-noorf_min30_max500.fasta.
- 4.1 Upload the FASTA file with experimental sites as sequence “Dataset 1”. Tag this set as “DBsites”
- 4.2 Upload upstream sequences file as “Dataset 2” and choose “Number of matrix permutations” = 1. Tag this set as “all_upstream”
- 4.3 Select a Markov background model of order 1 (precomputed in the server for E.coli)
- 4.4 Press “Submit”, the job will take some minutes.
| protein name | RegulonDB curated cis elements |
|---|---|
| Ada | Ada.fna |
| CRP | CRP.fna |
| DnaA | DnaA.fna |
| FadR | FadR.fna |
| LacI | LacI.fna |
| MarA | MarA.fna |
| NarL | NarL.fna |
| PhoB | PhoB.fna |
| PurR | PurR.fna |
| Rob | Rob.fna |
| TrpR | TrpR.fna |

matrix-quality plot of a structure-based matrix of TrpR from PDB entry 1rcs_AB

matrix-quality plot of a structure-based matrix of PurR from PDB entry 2pua_A
References
Contreras-Moreira, B. 2010. “3D-Footprint: A Database for the Structural Analysis of Protein-DNA Complexes.” Nucleic Acids Research 38: D91–97. http://nar.oxfordjournals.org/content/38/suppl\_1/D91.
Contreras-Moreira, B., J. Sancho, and V. E. Angarica. 2010. “Comparison of DNA binding across protein superfamilies.” Proteins 78 (1): 52–62. http://www.ncbi.nlm.nih.gov/pubmed/19731374.
Espinosa Angarica, V., A. González Pérez, A.T. Vasconcelos, J. Collado-Vides, and B. Contreras-Moreira. 2008. “Prediction of TF Target Sites Based on Atomistic Models of Protein-DNA Complexes.” BMC Bioinformatics 9: 436. http://www.biomedcentral.com/1471-2105/9/436.
Lewis, M., G. Chang, N. C. Horton, M. A. Kercher, H. C. Pace, M. A. Schumacher, R. G. Brennan, and P. Lu. 1996. “Crystal structure of the lactose operon repressor and its complexes with DNA and inducer.” Science 271 (5253): 1247–54. http://www.ncbi.nlm.nih.gov/pubmed/8638105.
Lu, X. J., and W. K. Olson. 2008. “3DNA: a versatile, integrated software system for the analysis, rebuilding and visualization of three-dimensional nucleic-acid structures.” Nat Protoc 3: 1213–27. http://www.nature.com/nprot/journal/v3/n7/full/nprot.2008.104.html.
Luscombe, N. M., S. E. Austin, H. M. Berman, and J. M. Thornton. 2000. “An overview of the structures of protein-DNA complexes.” Genome Biol. 1 (1): REVIEWS001. http://www.ncbi.nlm.nih.gov/pmc/articles/PMC138832/.
Luscombe, N. M., R. A. Laskowski, and J. M. Thornton. 2001. “Amino acid-base interactions: a three-dimensional analysis of protein-DNA interactions at an atomic level.” Nucleic Acids Res. 29 (13): 2860–74. http://nar.oxfordjournals.org/content/29/13/2860.long.
Medina-Rivera, A., C. Abreu-Goodger, M. Thomas-Chollier, H. Salgado, J. Collado-Vides, and J. van Helden. 2011. “Theoretical and empirical quality assessment of transcription factor-binding motifs.” Nucleic Acids Res. 39 (3): 808–24. http://nar.oxfordjournals.org/content/39/3/808.long.
Morozov, A. V., and E. D. Siggia. 2007. “Connecting protein structure with predictions of regulatory sites.” Proc. Natl. Acad. Sci. U.S.A. 104 (17): 7068–73. http://www.pnas.org/content/104/17/7068.long.
Noyes, M. B., R. G. Christensen, A. Wakabayashi, G. D. Stormo, M. H. Brodsky, and S. A. Wolfe. 2008. “Analysis of homeodomain specificities allows the family-wide prediction of preferred recognition sites.” Cell 133 (7): 1277–89.
Olson, W. K., A. A. Gorin, X. J. Lu, L. M. Hock, and V. B. Zhurkin. 1998. “DNA sequence-dependent deformability deduced from protein-DNA crystal complexes.” Proc. Natl. Acad. Sci. U.S.A. 95 (19): 11163–68. http://www.pnas.org/content/95/19/11163.long.
Sathyapriya, R., M. S. Vijayabaskar, and S. Vishveshwara. 2008. “Insights into protein-DNA interactions through structure network analysis.” PLoS Comput. Biol. 4 (9): e1000170. http://journals.plos.org/ploscompbiol/article?id=10.1371/journal.pcbi.1000170.
Sebastian, A., and B. Contreras Moreira. 2014. “footprintDB: a database of transcription factors with annotated cis elements and binding interfaces.” Bioinformatics 30 (2): 258–65. http://bioinformatics.oxfordjournals.org/content/30/2/258.full.
Sebastian, A., and B. Contreras-Moreira. 2013. “The twilight zone of cis element alignments.” Nucleic Acids Res. 41 (3): 1438–49. http://nar.oxfordjournals.org/content/41/3/1438.long.
Siggers, T. W., A. Silkov, and B. Honig. 2005. “Structural alignment of protein–DNA interfaces: insights into the determinants of binding specificity.” J. Mol. Biol. 345 (5): 1027–45. http://www.ncbi.nlm.nih.gov/pubmed/15644202.
Zhou, T., L. Yang, Y. Lu, I. Dror, A. C. Dantas Machado, T. Ghane, R. Di Felice, and R. Rohs. 2013. “DNAshape: a method for the high-throughput prediction of DNA structural features on a genomic scale.” Nucleic Acids Res. 41 (Web Server issue): 56–62. http://www.ncbi.nlm.nih.gov/pubmed/23703209.