Phylogenetic analysis of coronavirus sequences
Jacques van Helden
2021-02-15
## Color palette per species
speciesPalette <- list(
  Human = "#880000",
  Bat = "#888888",
  Pangolin = "#448800",
  Camel = "#BB8800",
  Pig = "#FFBBBB",
  Civet = "#00BBFF"
)

## Species prefix in the tip labels
speciesPrefix <- c("Hu" = "Human",
                   "Bt" = "Bat",
                   "Pn" = "Pangolin",
                   "Cm" = "Camel",
                   "Pi" = "Pig",
                   "Cv" = "Civet")

## Strain-specific colors
strainColor <- c(
  "HuCoV2" = "red",
  "HuSARS-Fr" = "#0044BB",
  "PnGu1" = "#00BB00",
  "BtRaTG13" = "#FF6600",
  "BtYu-RmYN" = "#FFBB22",
  "BtZXC21" = "black",
  "BtZC45" = "black")

## Define feature types
features <- c(
  # "genomes",
  # "S-gene",
  "S1",
  "S2",
  "RBD",
#  "Recomb-Xiao",
  "Recomb-reg-1",
  "Recomb-reg-2",
  "Recomb-reg-3",
  "CDS-ORF1ab",
  "After-ORF1ab",
  "CDS-S",
  "CDS-ORF3a",
  "CDS-E",
  "CDS-M",
  "CDS-ORF6",
  "CDS-ORF7a",
  "CDS-ORF8",
  "CDS-N",
  "CDS-ORF10")
feature <- "S-gene"

## Define collections
collections <- c("around-CoV-2", "selected")
collection <- "around-CoV-2" # default for testing

## Outgroup per collection
outgroups <- list()
outgroups[["selected"]] <- c(
  "HuOC43",
  "PiPRCV",
  "HuTGEV",
  "PiSADS",
  "Hu229E",
  "HuNL63")
outgroups[["around-CoV-2"]] <- "BtBM48-31"

## Use GISAID data
useGISAID <- TRUE
if (useGISAID) {
  collections <- paste0(collections, "-plus-GISAID")
  for (collection in names(outgroups)) {
    outgroups[[paste0(collection, "-plus-GISAID")]] <- outgroups[[collection]]
  }
  collection <- paste0(collection, "-plus-GISAID")
}
dir <- vector()
dir["main"] <- ".."
dir["results"] <- file.path(dir["main"], "results")
dir["genomes"] <- file.path(dir["results"], "genome_phylogeny", "clustalw_alignments")
dir["R"] <- file.path(dir["main"], "scripts", "R")
# list.files(dir["R"])
source(file.path(dir["R"], "load_tree.R"))
source(file.path(dir["R"], "plot_my_tree.R"))Phylogeny from full genomes
We inferred a phylogeny of virus strains based ontheir full genomes.
A multiple alignment of genome sequences was performed with a progressive method (clustalw). The tree of virus strains was inferred with a maximum likelihood approach (phyml software).
#### Load and plot the genome tree ####
genomeTreeFile <- file.path(
  dir["genomes"],
  "coronavirus_selected-plus-GISAID_genomes_clustalw_gblocks.phy_phyml_tree.phb")


genomeTree <- loadTree(
  treeFile = genomeTreeFile,
  outgroup = outgroups[['selected']],
  rootNode = NULL,
  speciesPalette = speciesPalette,
  tipColor = strainColor,
  nodesToRotate = c(39, 75, 42))
# genomeTree <- paintSubTree(tree = genomeTree, node = 49, state = "CoV2")

plotMyTree(genomeTree, main  = "Genome-based virus tree",
           scaleLength = 0.1,
           show.node.label = FALSE)
# nodelabels(cex = 0.4)

## Identify some clades
cladelabels(genomeTree$tree, "CoV2", 46, cex = 0.7, orientation = "horizontal", offset = 5)
cladelabels(genomeTree$tree, "MERS", 43, cex = 0.7, orientation = "horizontal", offset = 5)
cladelabels(genomeTree$tree, "SARS", 69, cex = 0.7, orientation = "horizontal", offset = 5)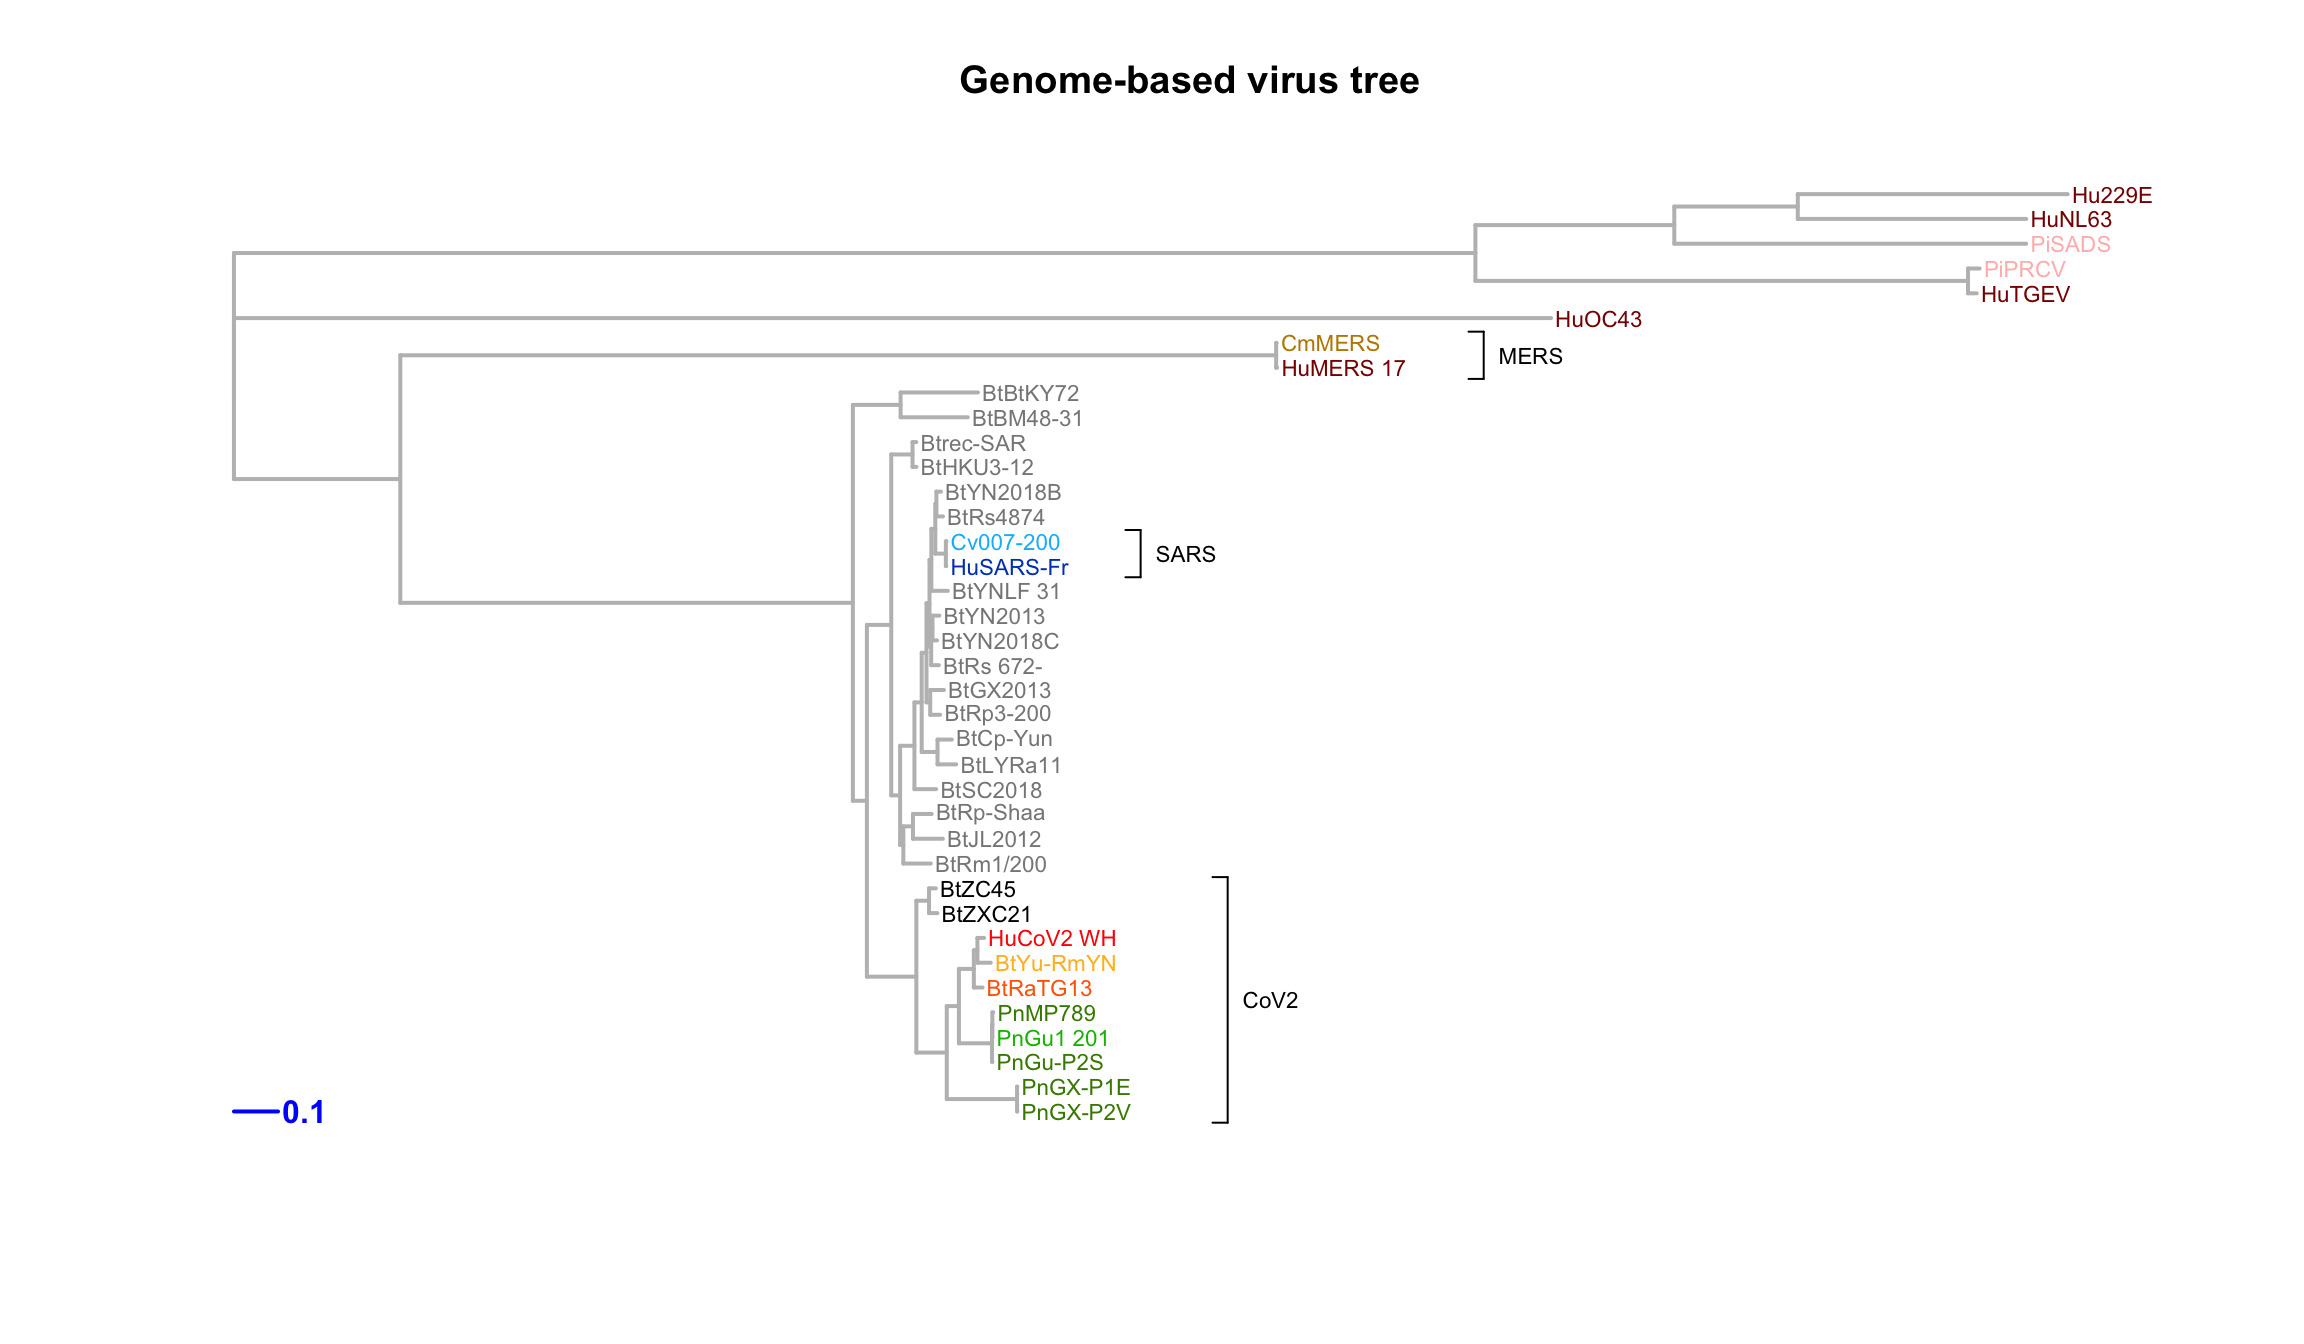
Genome tree of selected coronaviruses. The tree was inferred by maximum likelihood apprroach (PhyML) based on a progressive multiple alignment (clustalw).
Tree per feature
#### Load and plot feature-specific trees ####

## Define vectors to hold the results and enable tree comparisons
treeFiles <- vector()
treeData <- list()

## Define the path to the tre file
feature <- "RBD"

for (feature in features) {
  cat("  \n### ",  feature, "\n")

  message("\n\tReading tree for feature ", feature)
  prefix <- paste0(feature, "_", collection)
  treeFile <- file.path(
    dir["results"],
    prefix,
    paste0(prefix, "_clustalw_gblocks.phy_phyml_tree_GTR.phb"))
  treeFiles[feature] <- treeFile


  ## Load the  tree
  treeData[[feature]] <- loadTree(
    treeFile = treeFiles[feature],
    outgroup = outgroups[[collection]],
    rootNode = NULL,
    speciesPalette = speciesPalette,
    tipColor = strainColor,
    nodesToRotate = NULL)

  plotMyTree(treeData[[feature]],
             main  = paste0(feature, " tree"),
             scaleLength = 0.05, cex = 1, label.offset = 0.01,
             show.node.label = FALSE)

  # ## Identify some clades
  # cladelabels(genomeTree$tree, "CoV2", 46, cex = 0.7, orientation = "horizontal", offset = 5)
  # cladelabels(genomeTree$tree, "MERS", 43, cex = 0.7, orientation = "horizontal", offset = 5)
  # cladelabels(genomeTree$tree, "SARS", 69, cex = 0.7, orientation = "horizontal", offset = 5)
}
S1
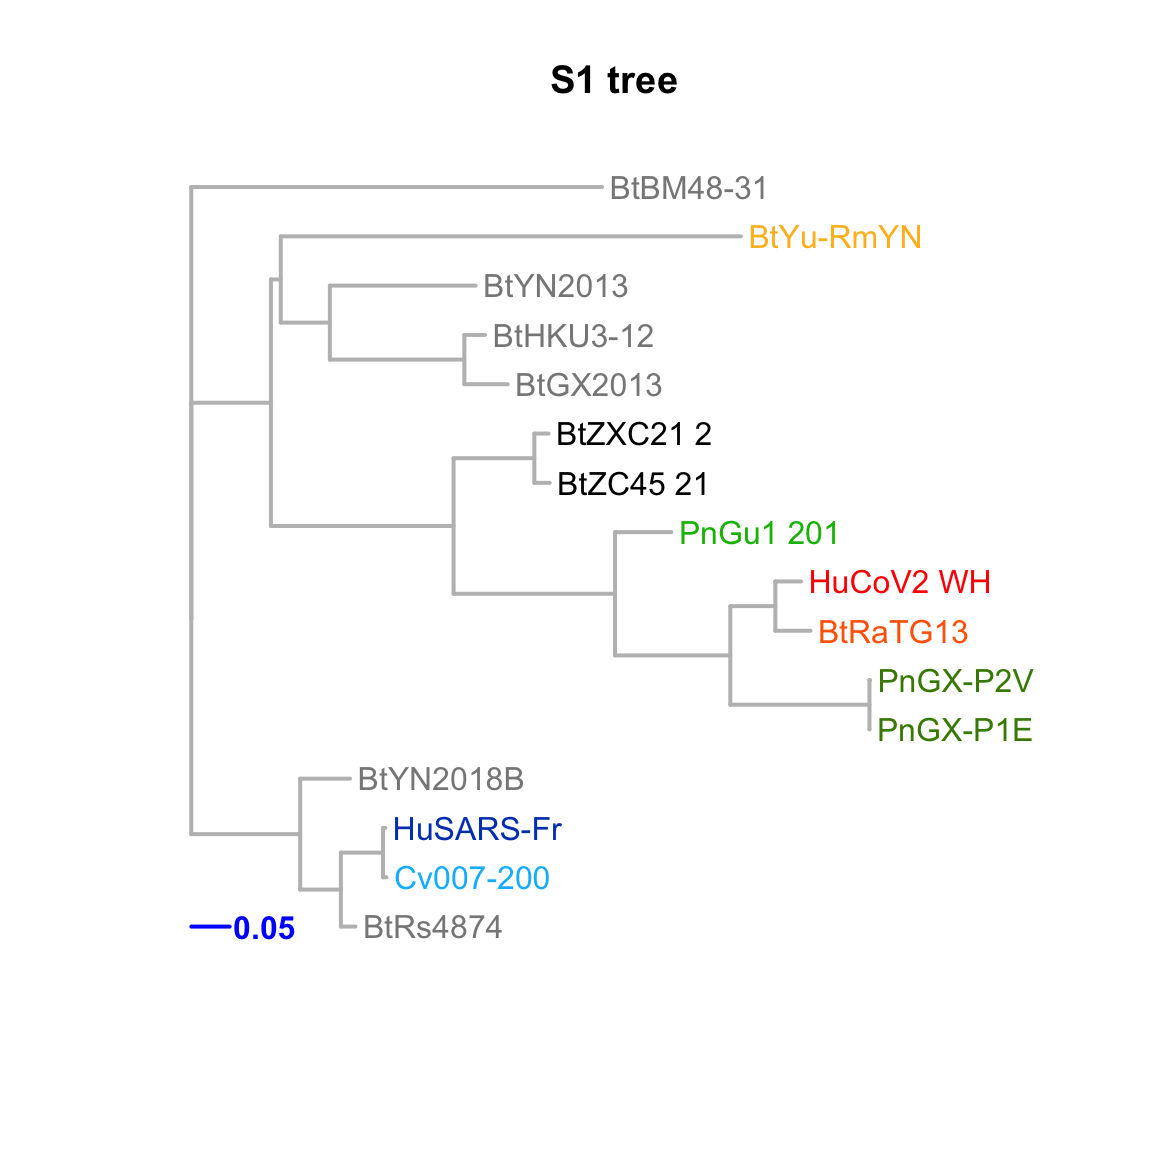
Feature-specific tree. The tree was inferred by maximum likelihood apprroach (PhyML) based on a progressive multiple alignment (clustalw).
S2
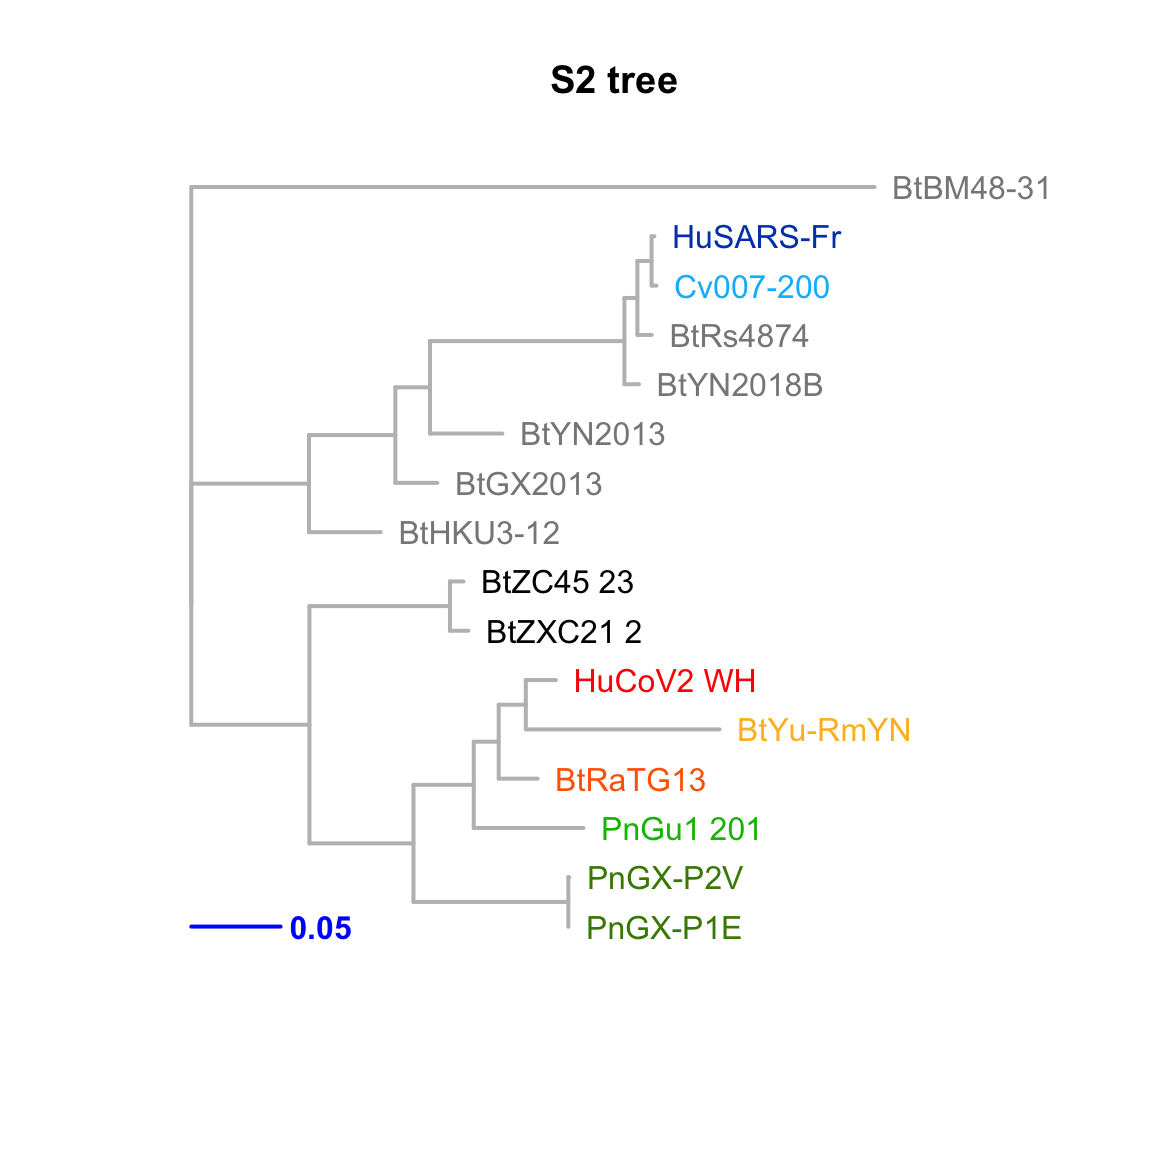
Feature-specific tree. The tree was inferred by maximum likelihood apprroach (PhyML) based on a progressive multiple alignment (clustalw).
RBD
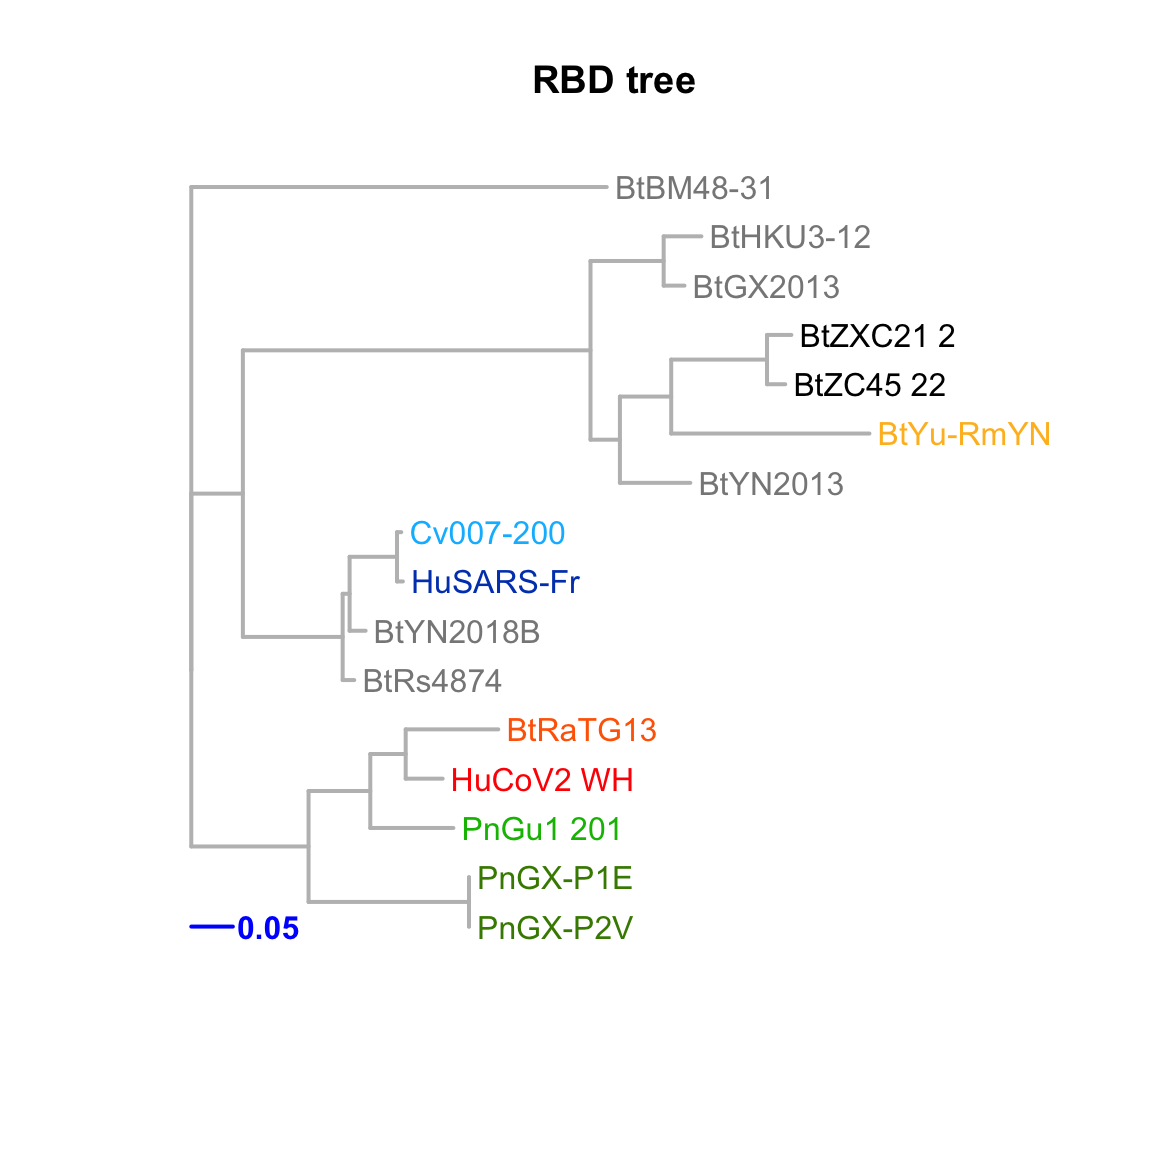
Feature-specific tree. The tree was inferred by maximum likelihood apprroach (PhyML) based on a progressive multiple alignment (clustalw).
Recomb-reg-1
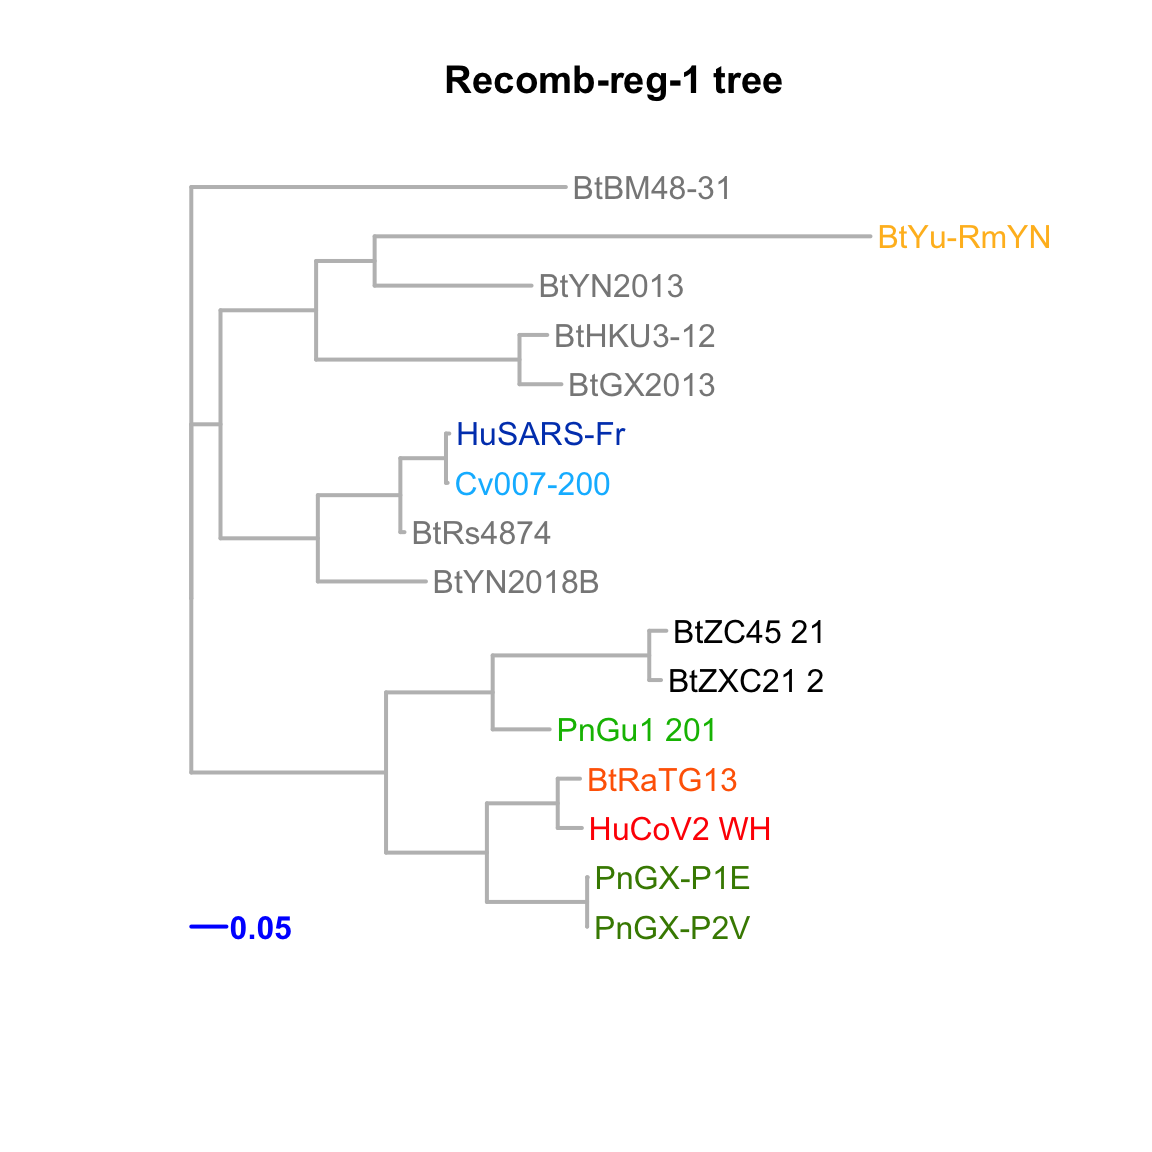
Feature-specific tree. The tree was inferred by maximum likelihood apprroach (PhyML) based on a progressive multiple alignment (clustalw).
Recomb-reg-2
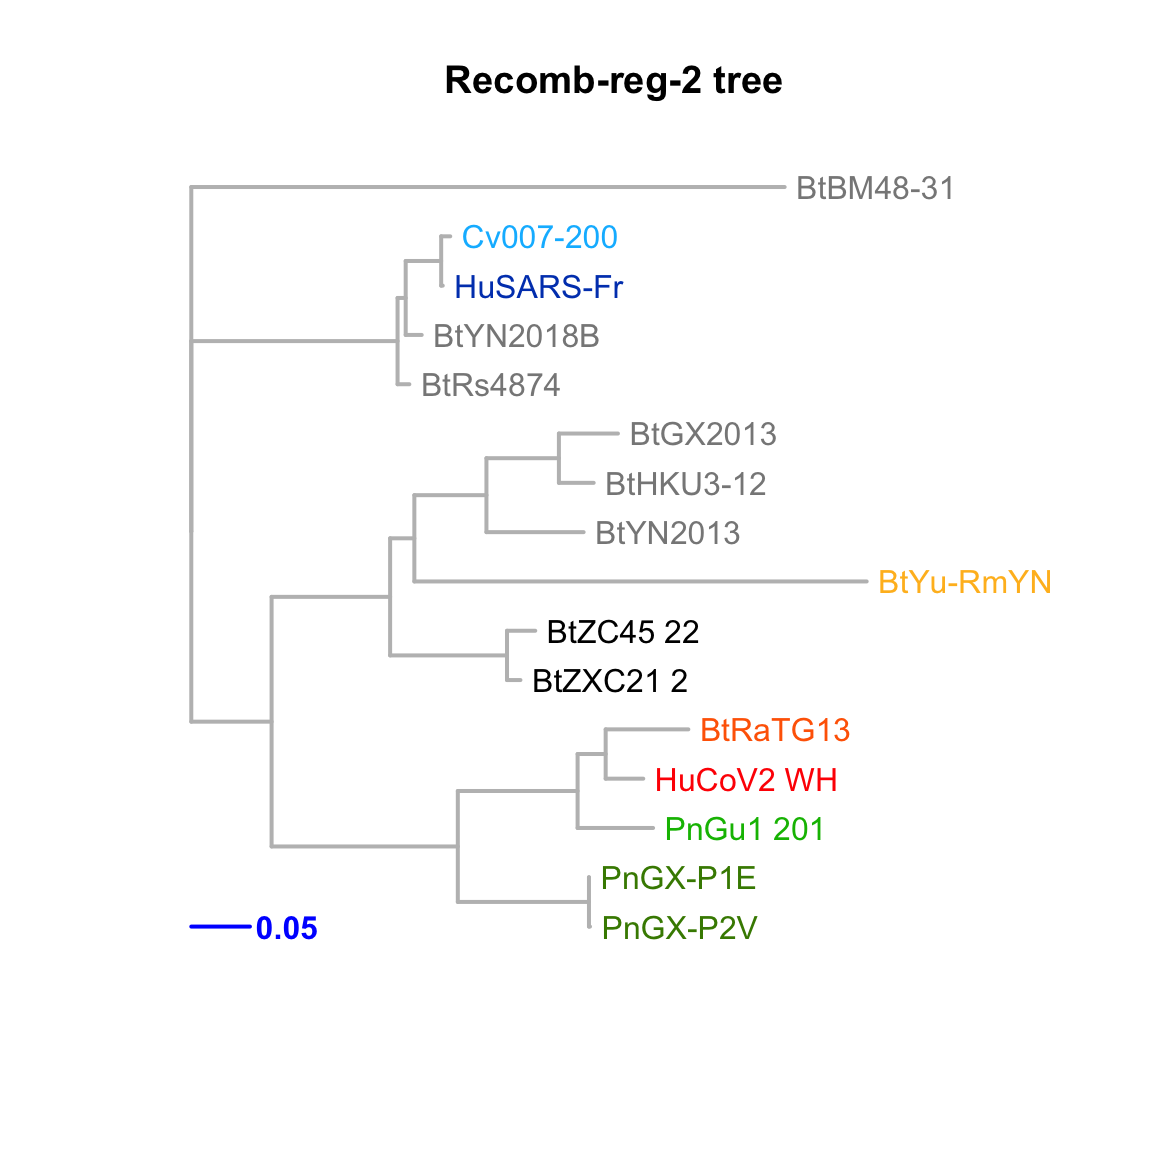
Feature-specific tree. The tree was inferred by maximum likelihood apprroach (PhyML) based on a progressive multiple alignment (clustalw).
Recomb-reg-3
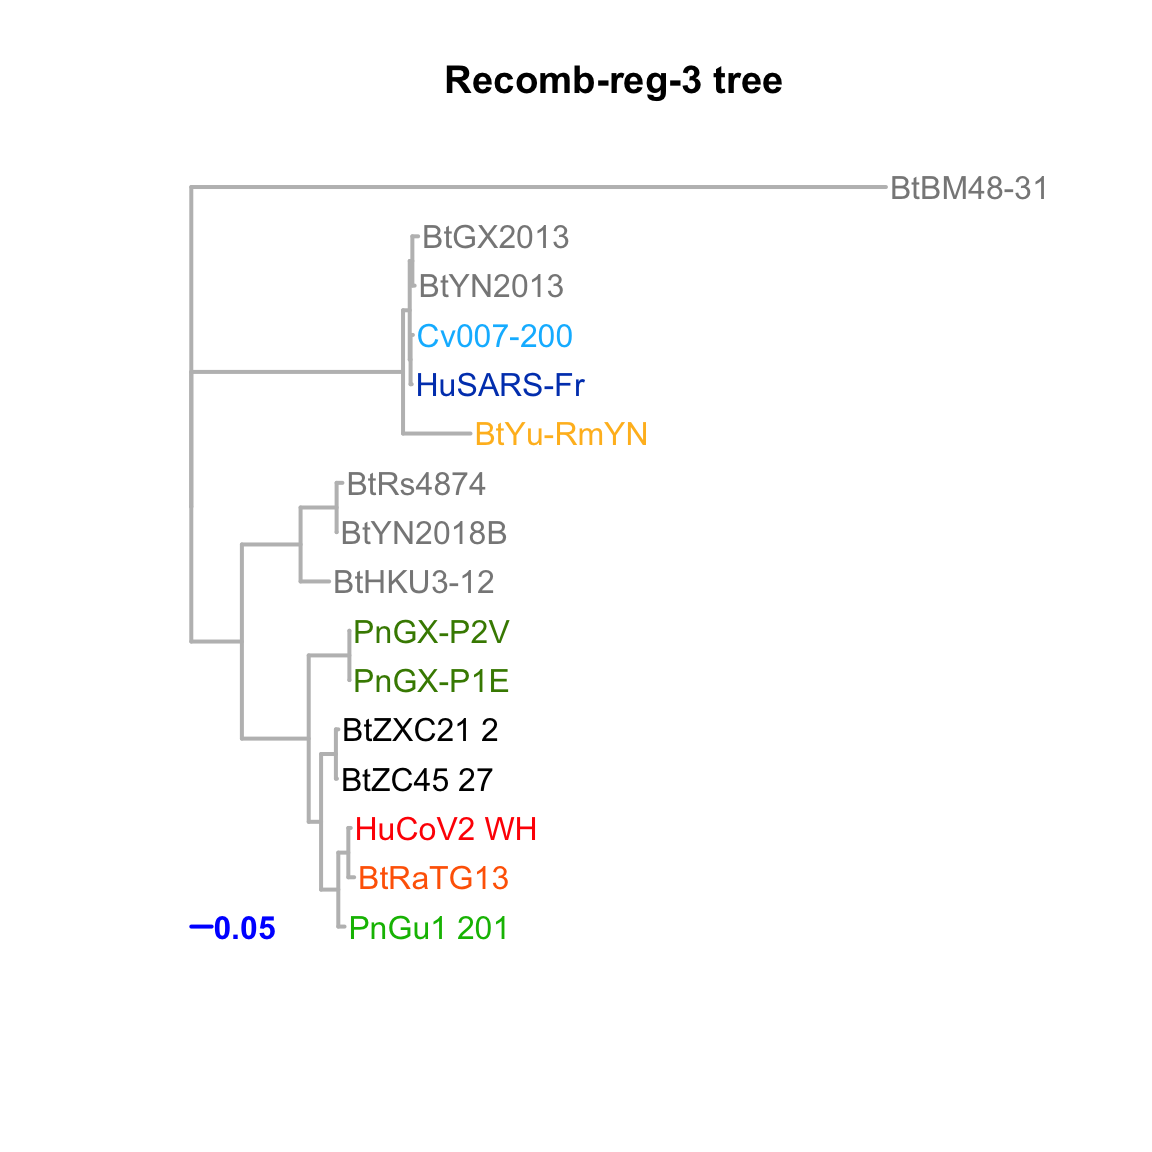
Feature-specific tree. The tree was inferred by maximum likelihood apprroach (PhyML) based on a progressive multiple alignment (clustalw).
CDS-ORF1ab
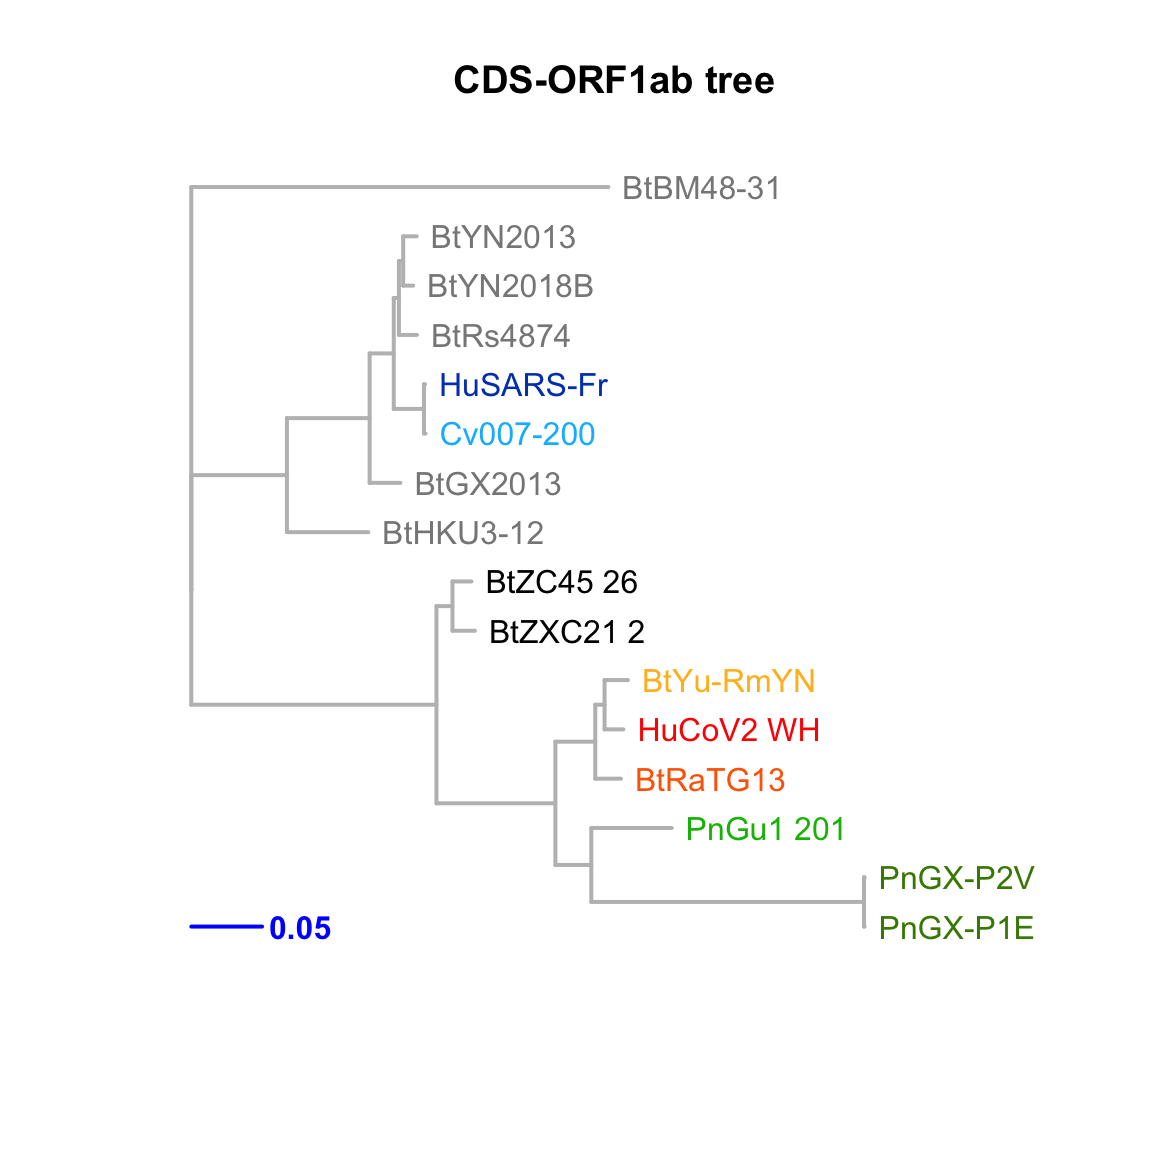
Feature-specific tree. The tree was inferred by maximum likelihood apprroach (PhyML) based on a progressive multiple alignment (clustalw).
After-ORF1ab
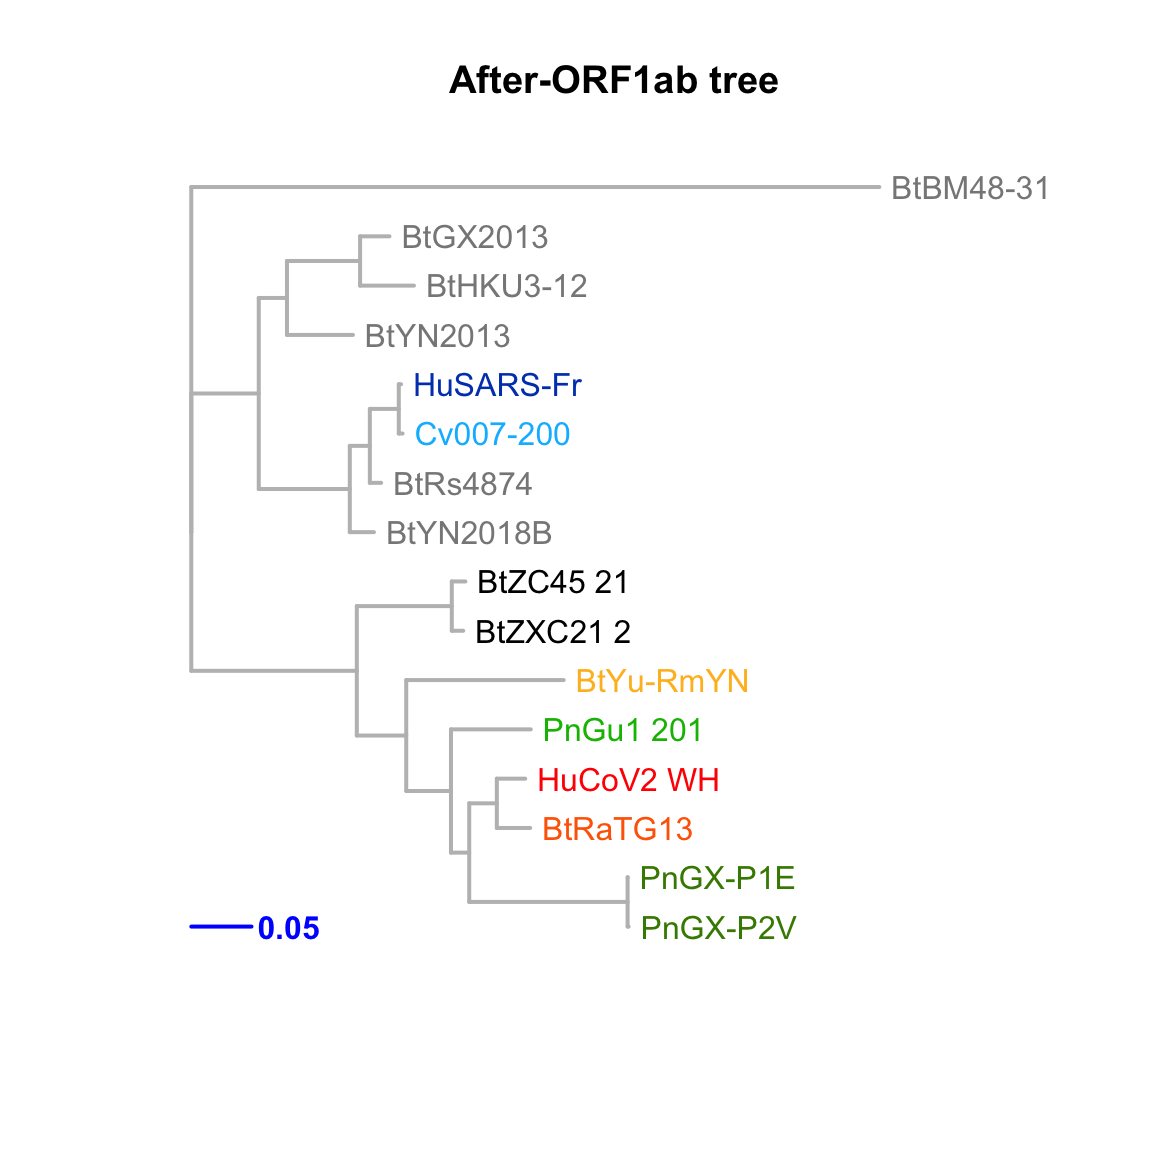
Feature-specific tree. The tree was inferred by maximum likelihood apprroach (PhyML) based on a progressive multiple alignment (clustalw).
CDS-S
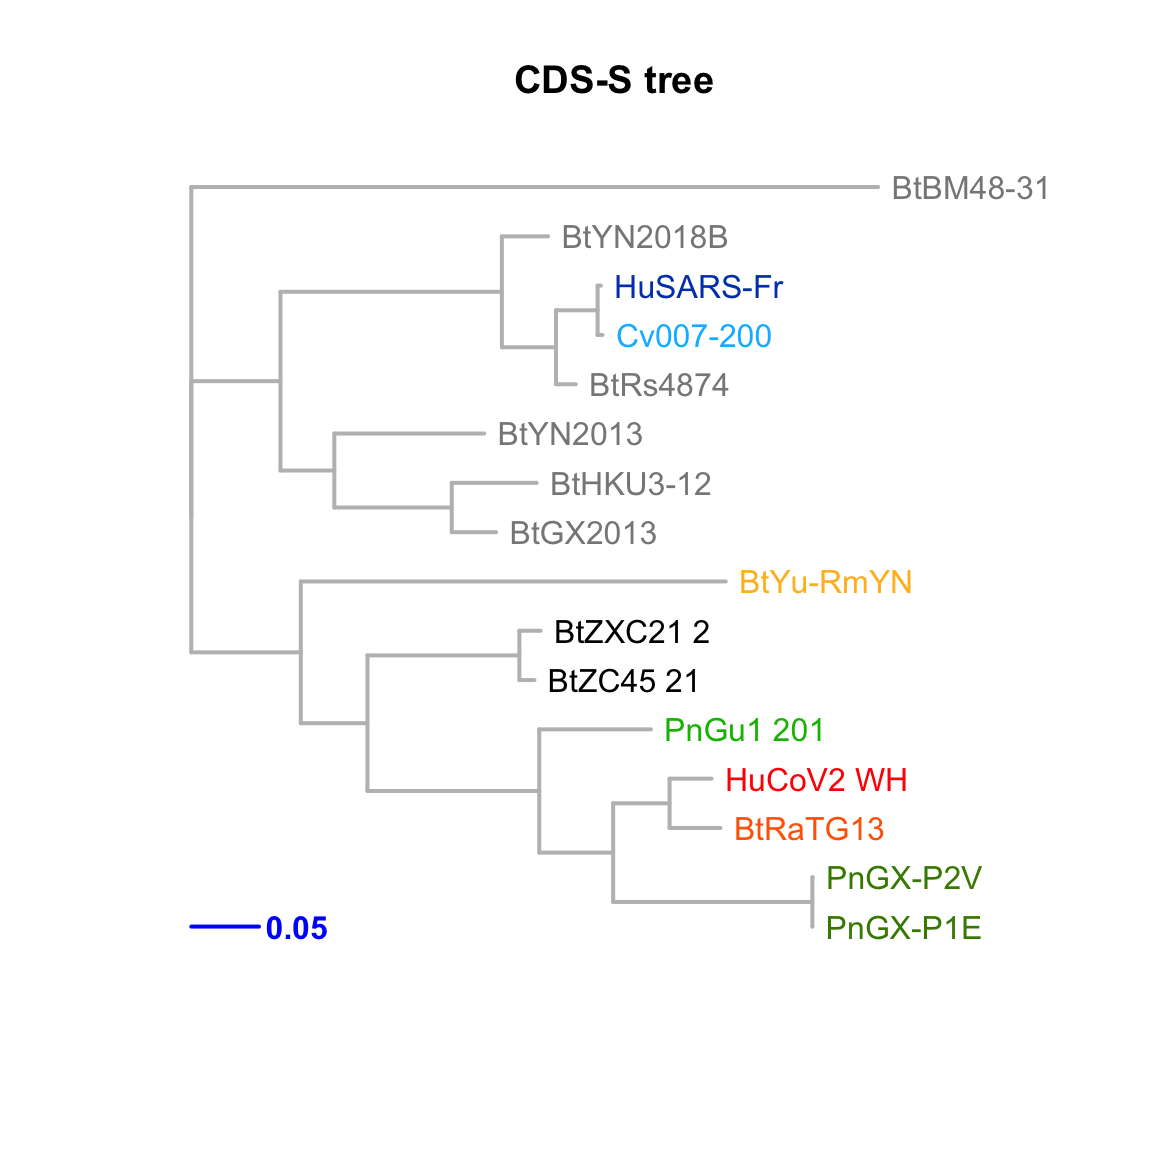
Feature-specific tree. The tree was inferred by maximum likelihood apprroach (PhyML) based on a progressive multiple alignment (clustalw).
CDS-ORF3a
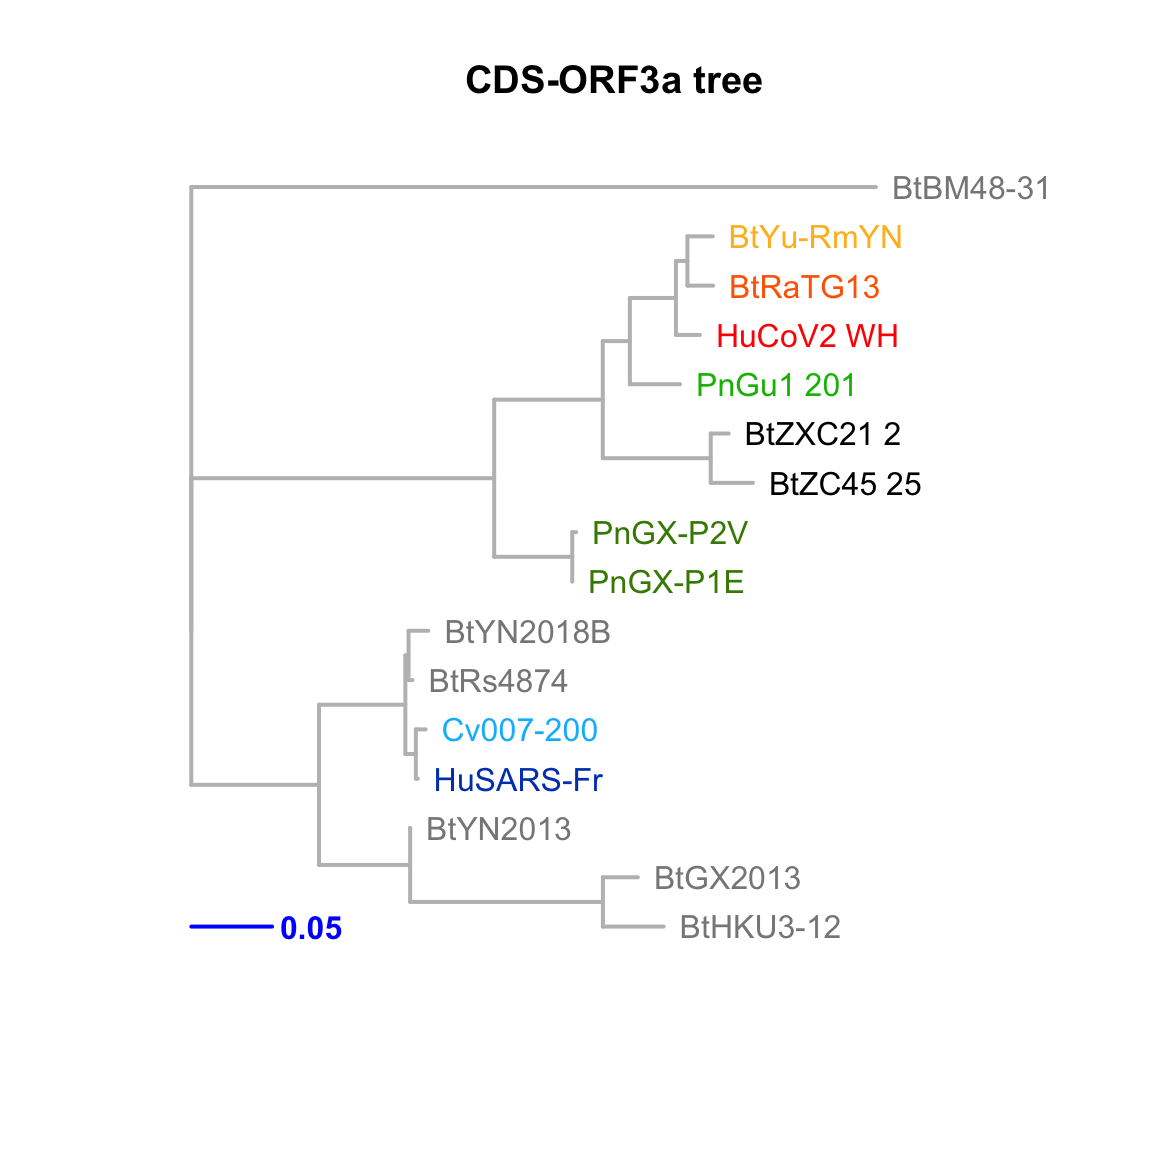
Feature-specific tree. The tree was inferred by maximum likelihood apprroach (PhyML) based on a progressive multiple alignment (clustalw).
CDS-E
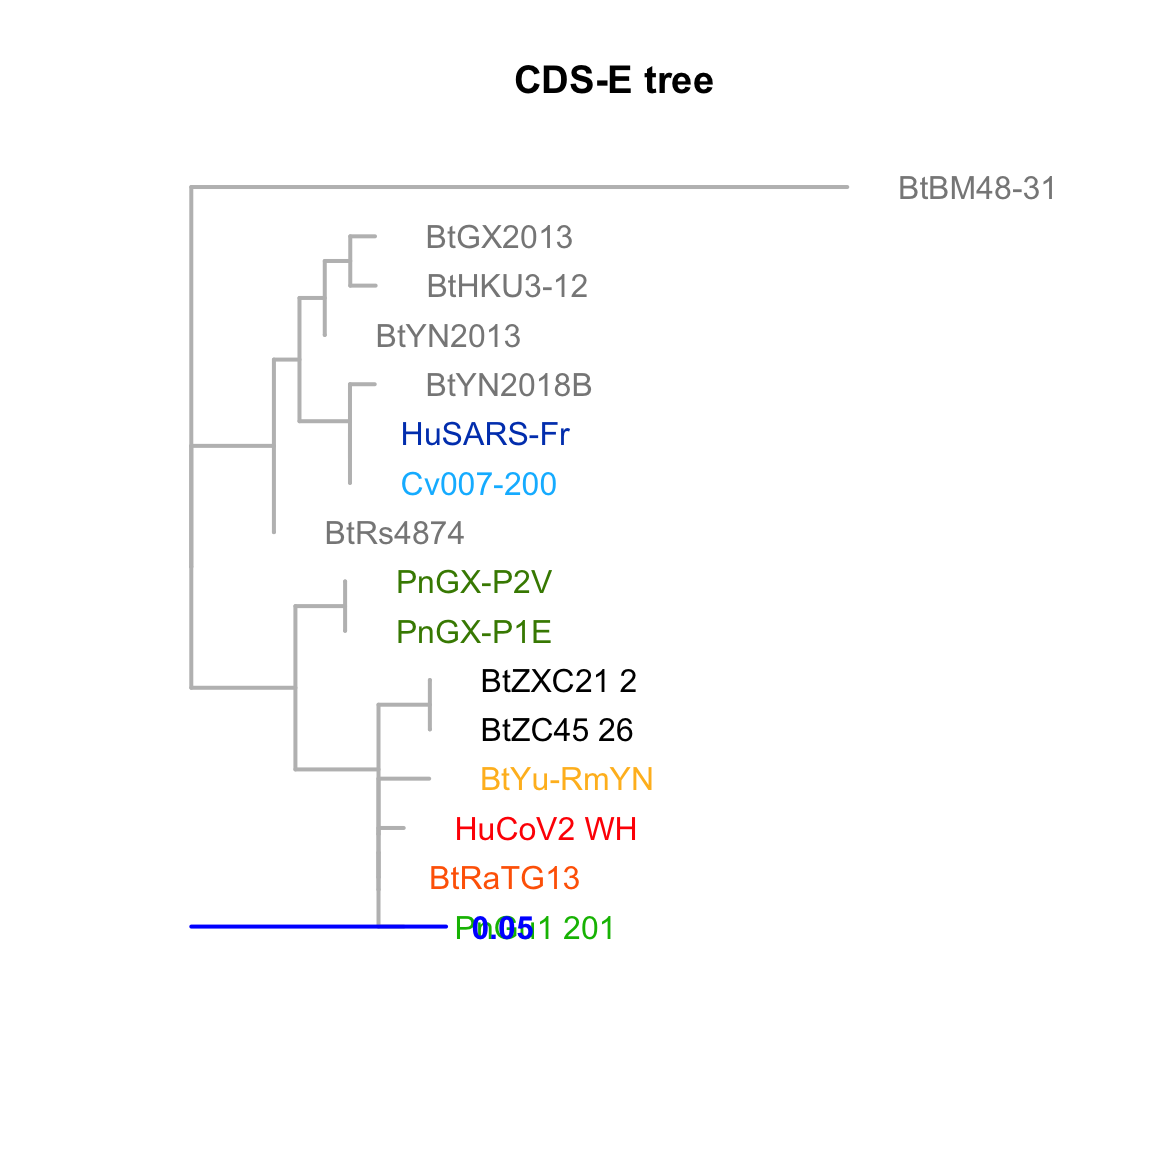
Feature-specific tree. The tree was inferred by maximum likelihood apprroach (PhyML) based on a progressive multiple alignment (clustalw).
CDS-M
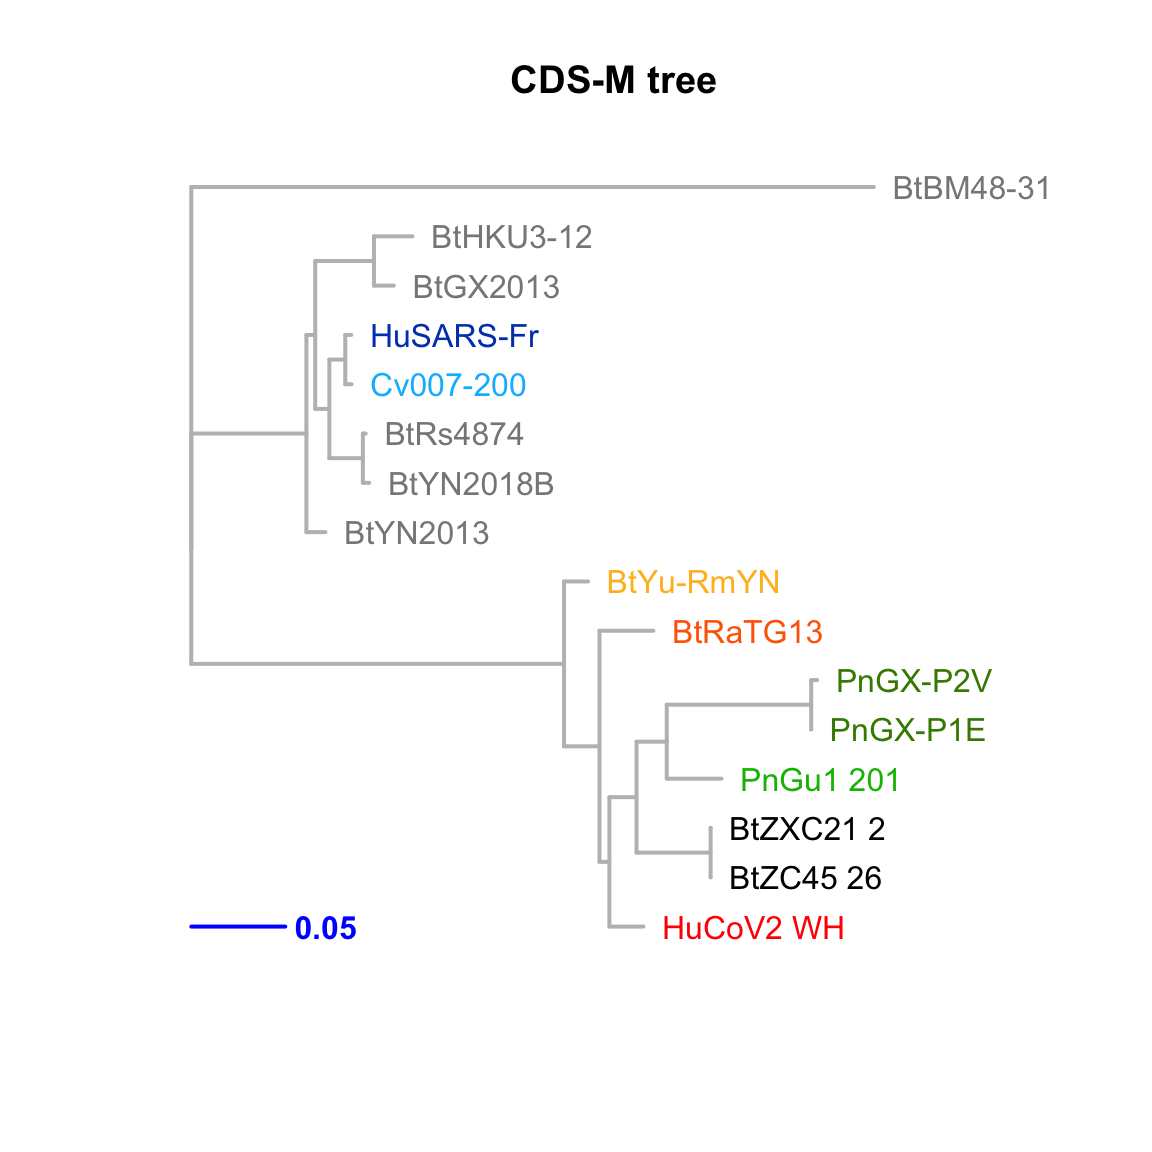
Feature-specific tree. The tree was inferred by maximum likelihood apprroach (PhyML) based on a progressive multiple alignment (clustalw).
CDS-ORF6
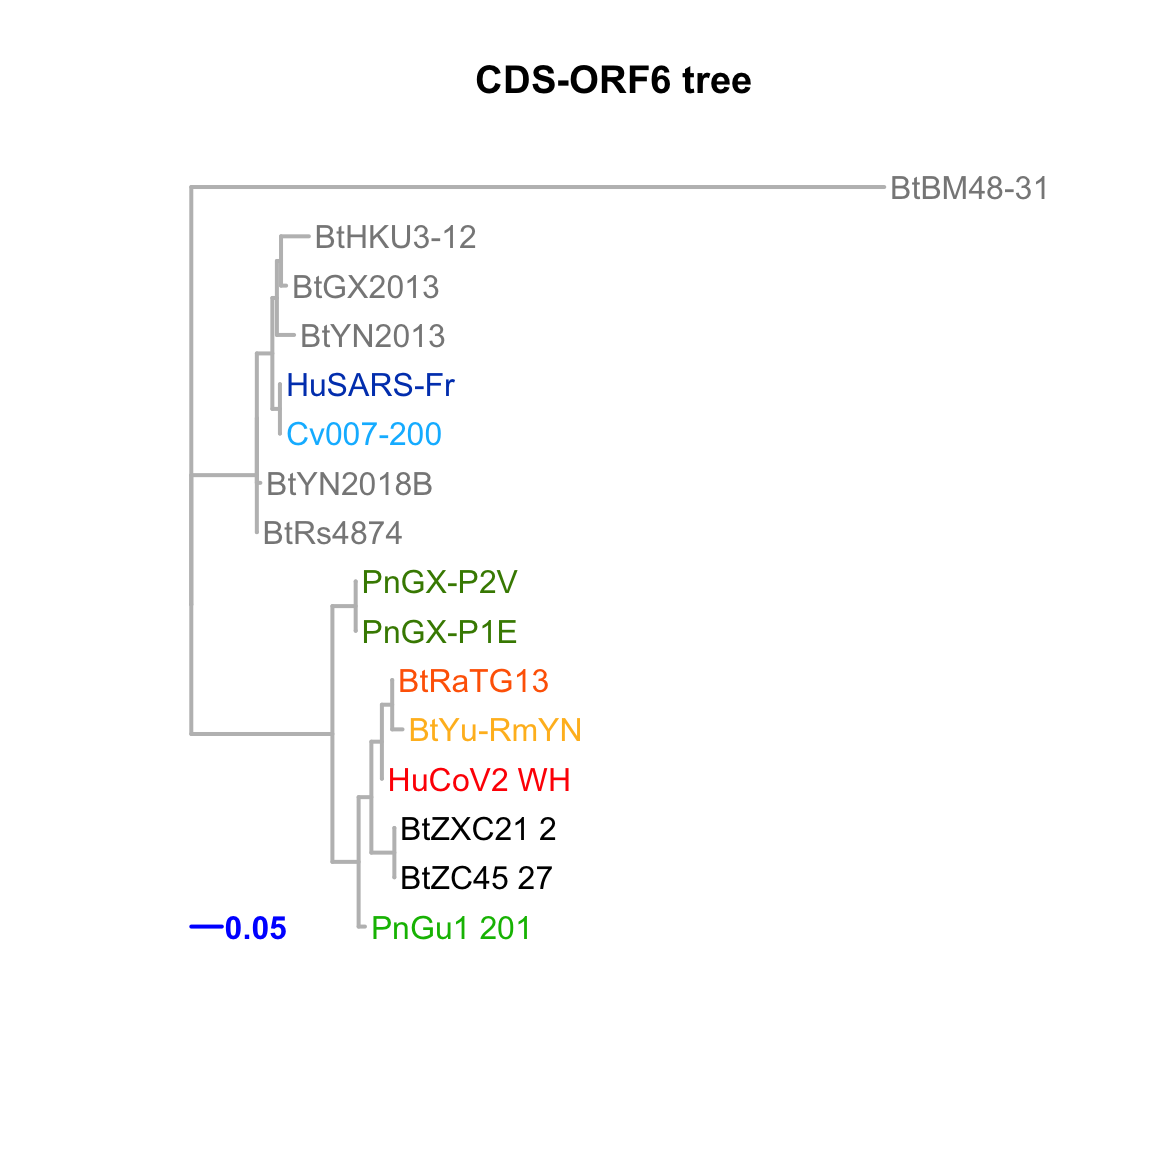
Feature-specific tree. The tree was inferred by maximum likelihood apprroach (PhyML) based on a progressive multiple alignment (clustalw).
CDS-ORF7a
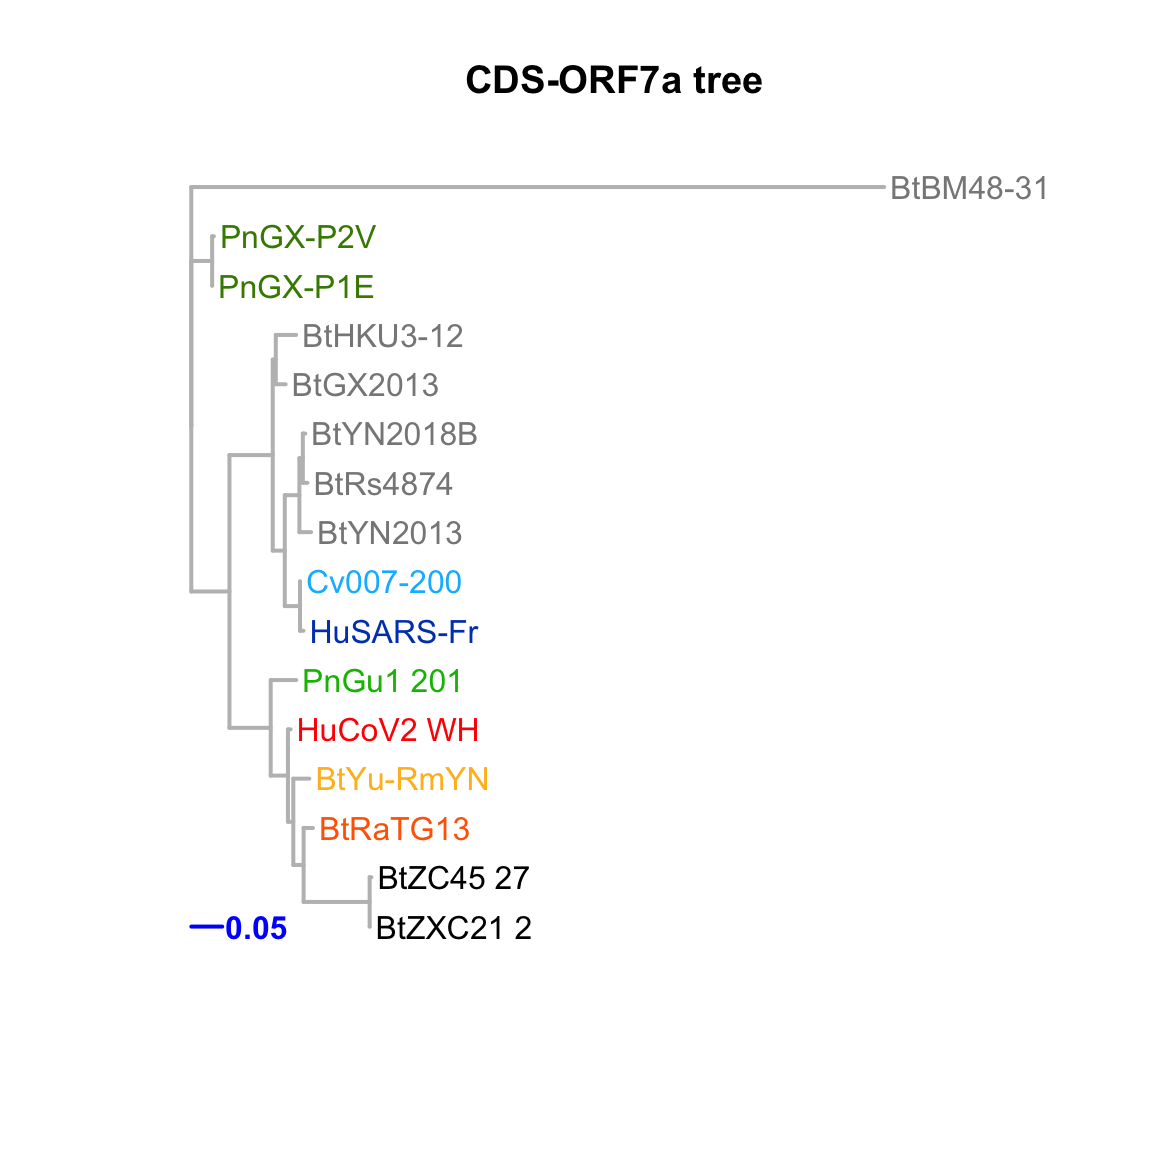
Feature-specific tree. The tree was inferred by maximum likelihood apprroach (PhyML) based on a progressive multiple alignment (clustalw).
CDS-ORF8
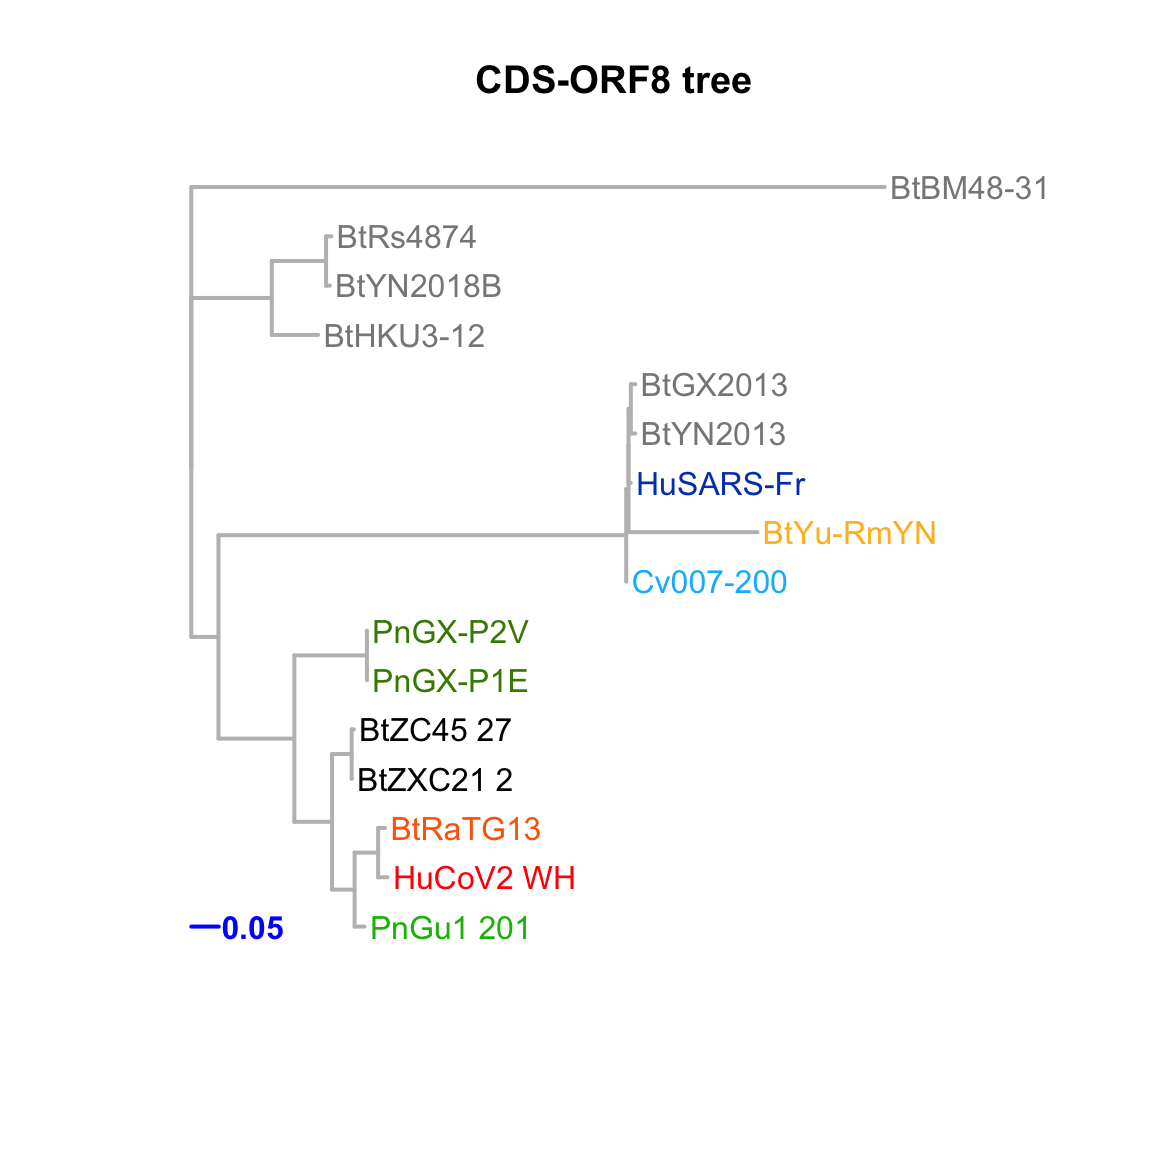
Feature-specific tree. The tree was inferred by maximum likelihood apprroach (PhyML) based on a progressive multiple alignment (clustalw).
CDS-N
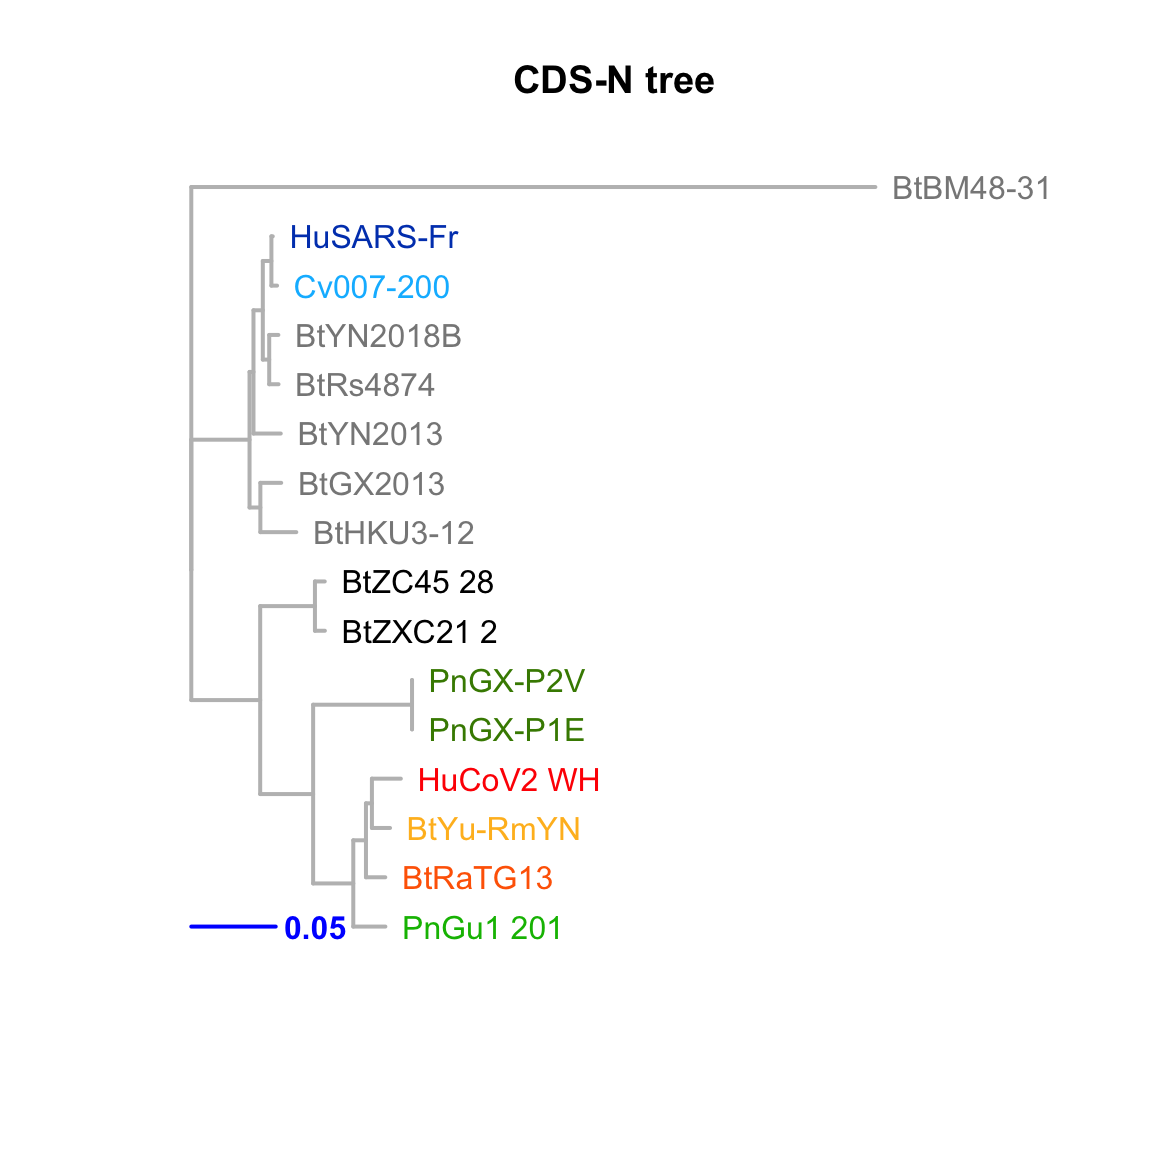
Feature-specific tree. The tree was inferred by maximum likelihood apprroach (PhyML) based on a progressive multiple alignment (clustalw).
CDS-ORF10
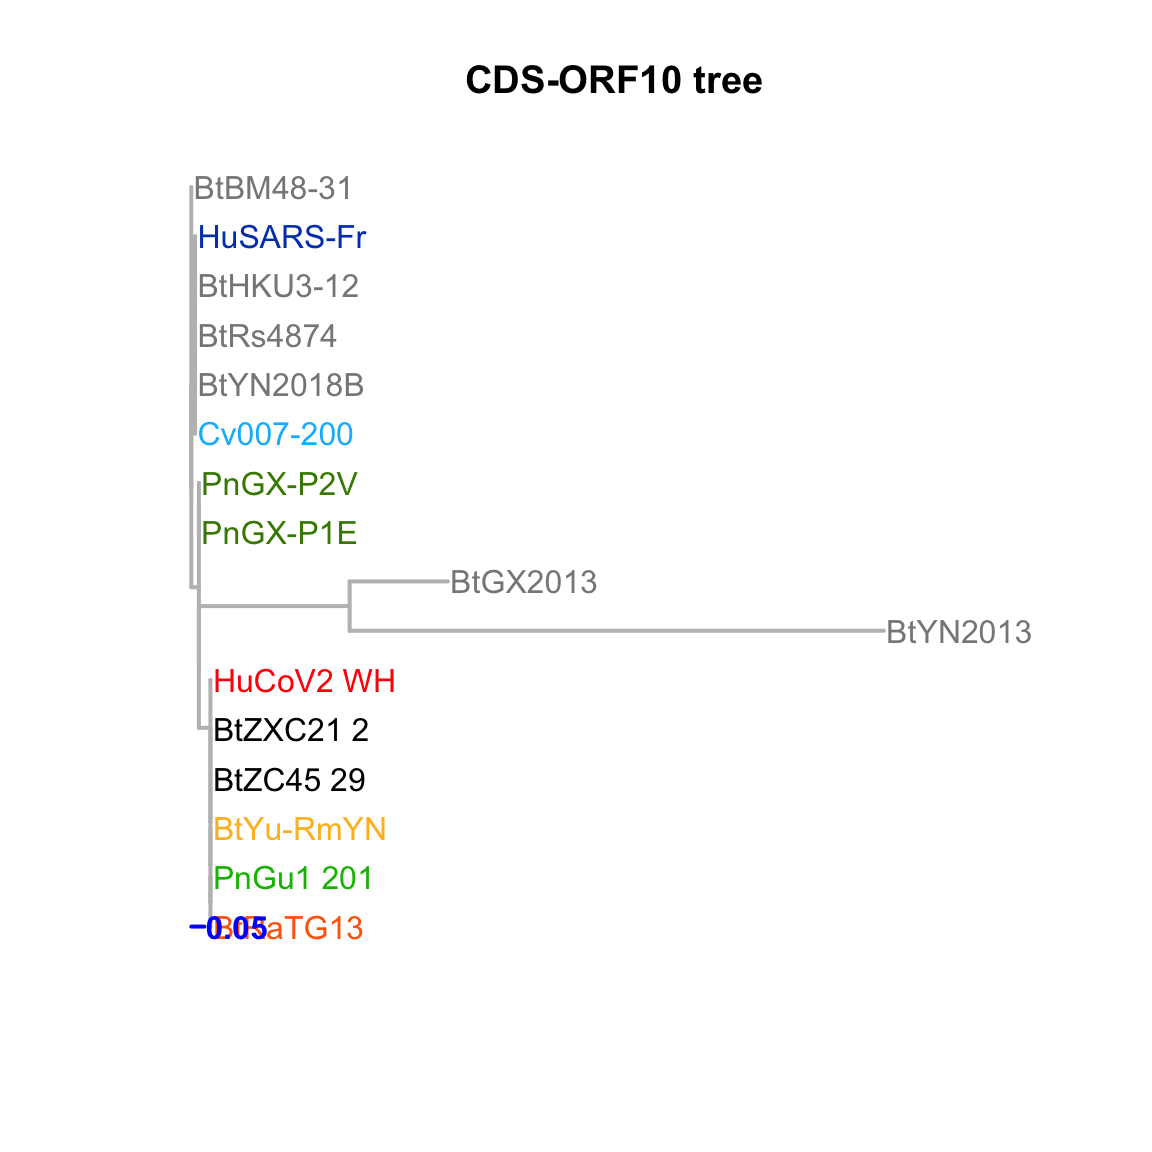
Feature-specific tree. The tree was inferred by maximum likelihood apprroach (PhyML) based on a progressive multiple alignment (clustalw).